Oops! Something went wrong while submitting the form.
Notice: It looks like you are visiting us from United Arab Emirates or have selected it as your residency location.
For accurate information and services under the correct licensed entity, please visit the appropriate section of our website. For more information view Regulatory Information
For accurate information and services under the correct licensed entity, please visit the appropriate section of our website. For more information view Regulatory Information
For educational purposes only, not investment advice.
Price action trading is the practice of analyzing raw price movements on a price chart to make decisions, without relying on technical analysis tools such as lagging indicators like RSI or MACD.
If your charts feel cluttered, or your indicator signals always seem to arrive a bar too late, reading price directly is a cleaner way to interpret what buyers and sellers are actually doing. Done well, it reveals market psychology through three things: candlestick behavior, support and resistance, and trend structure.
This guide breaks reading price into a repeatable routine. It covers what price action is, how it compares to indicators, and three essentials: market structure (the highs and lows), key levels (the "where"), and a small set of candlestick triggers (the "when"), then combines them into a five-step checklist.
[[aa-key-takeaways]]
Key Takeaways
Price action strips a chart to raw price data, so a trader can interpret sentiment in real time without the lag built into indicator-based systems.
Market structure, sequences of higher highs and higher lows (uptrend) or lower highs and lower lows (downtrend), is the foundation of every price action decision.
Support and resistance mark zones where buying or selling pressure has historically clustered, which guides where to enter, exit, and place stops.
Three candlestick patterns (the pin bar, engulfing, and inside bar) offer higher-probability signals when they form at a key level aligned with the trend.
A five-step checklist (trend context → key levels → signal candle → stop placement → target) turns subjective chart reading into a systematic process; it improves consistency, not certainty.
[[/a]]
[[aa-cta]]
Read Clean Charts, Execute in One Click
Apply price action across forex, gold, indices, and crypto from B2PRIME's unified account, with native TradingView charting.
Price action is the study of how price moves unfold on candlestick charts, candle by candle, rather than a derivative of it. Every candlestick encodes the collective trading decisions of the traders behind it, turning fear, greed, hesitation, and confidence into visible shapes and sequences.
That directness is the point. An indicator is calculated from prices that have already printed, so it always reports the market with a delay. In contrast, a price reader watches current behavior as it forms on the chart.
Because raw price exists wherever there is liquidity, the same skill carries across financial markets, from forex and a stock chart to indices, commodities, and crypto, on any timeframe. For a broader tour of the method, see our guide to price action trading strategies.
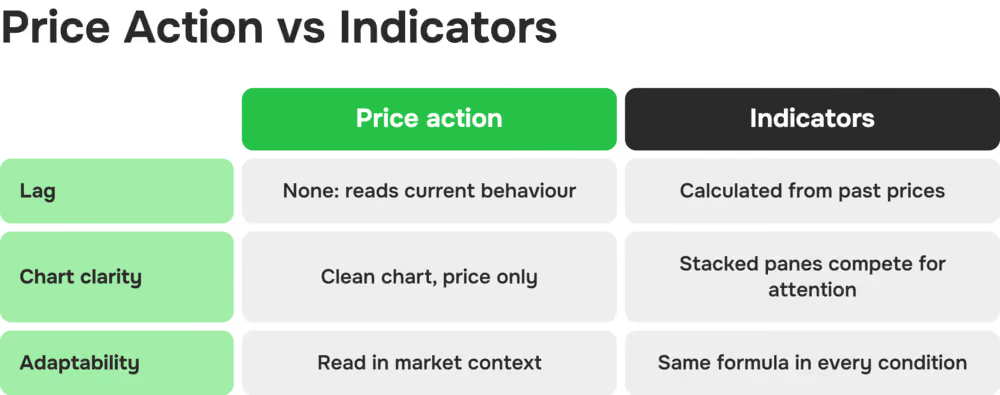
Price Action vs Indicators
Three differences stand out:
Lag. Indicators are computed from past prices and trail the market. Price action requires less waiting.
Chart clarity. A price action chart stays clean, while stacked technical indicators compete for attention at the worst moment.
Adaptability. A formula applies the same calculation in every condition. A price reader adjusts to the context in front of them.
This is not a dismissal of indicators, which suit different styles. The more useful framing is that price action is the foundation indicators attempt to quantify, so learning to read price first makes any later indicator use more effective, because you understand what the indicator is actually measuring.
Reading Market Structure
Market structure is the first skill to develop, because without it, candlestick patterns lack context. Structure is simply the sequence of swing highs and swing lows, often joined by trend lines, that reveals who controls the market.
Confirm the Trend With Highs and Lows
An uptrend prints higher highs and higher lows; a downtrend prints lower highs and lower lows. The practical step is to mark the most recent price swing high and low, then compare them to the prior swings. In trending markets, trading pullbacks in the direction of that structure raises the probability of a setup, while counter-trend trades need extra confirmation.
Spot Consolidation Boxes
Consolidation is a trading range, sideways movement between horizontal support and resistance, a "box" where neither side dominates. It matters because it often precedes a breakout and can trap traders who enter too early. Draw a line at the highest high and lowest low of the range and wait for a decisive close outside it. Trading inside the box without a clear edge means betting on indecision.
Watch for Structure Breaks
A structure break is a violation of the established sequence, for example, an uptrend printing a lower low, which may mark potential trend reversals. Confirmation is two-step: the break happens, then a retest of the broken level helps confirm the shift. Reacting to the first break is risky because false breakouts are common, so a candle close beyond the level matters more than an intrabar spike. Structure breaks also define invalidation points for stop placement, beyond the last valid swing.
Spotting Support and Resistance
If structure shows direction, support and resistance show where reactions are likely. Three methods cover most cases.
Horizontal Swing Levels
Swing levels are prior highs (resistance) and prior lows (support) where price clearly reversed. Scan left for obvious turning points; more touches typically increase a level's significance. Treat levels as zones with some width, allowing for wick penetration, and prioritize levels visible on higher timeframes such as H4 and the daily chart.
Round Psychological Numbers
Round numbers such as 1.3000 in EUR/USD or 20,000 in BTC/USD tend to gather orders because both institutions and retail traders place limits and stops around them, creating liquidity pools. In forex trading especially, a round number in confluence with a prior swing level carries more weight than either signal alone.
Retest Validation Wicks
A retracement is when price returns to a broken level, now flipped from support to resistance or vice versa, before continuing. A candle that wicks into the level but closes back in the breakout direction validates it. Retests tend to be lower-risk entries than breakouts because traders act after confirmation rather than in anticipation, and these reactions often form recognizable candlestick patterns.
High-Signal Candlestick Patterns
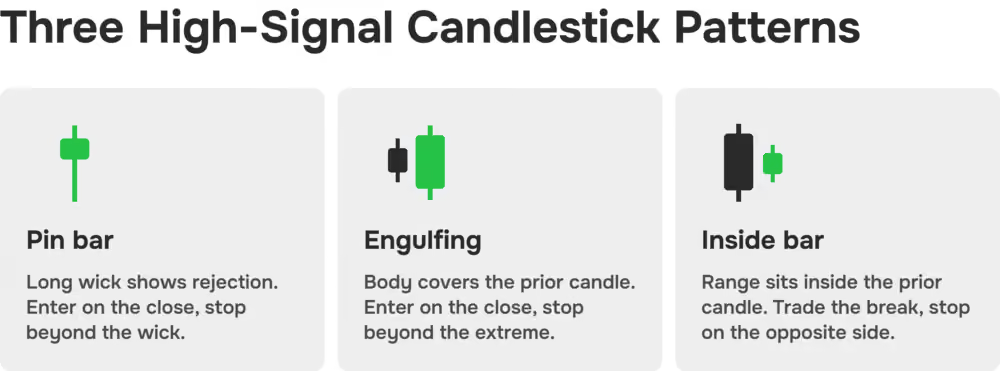
Candlesticks are the "when" of price action, timing tools used once structure and levels are defined. They matter most at a key level aligned with the trend; mid-range signals are lower quality. Three price action patterns offer a strong signal-to-noise ratio, and our overview of chart patterns covers more.
Pin Bar Rejection
A pin bar has a small body and a long wick that points toward the rejected direction. It reflects price pushing strongly one way before the opposite side overpowered it within the same candle. A common approach is to enter on the close or on a break of the "nose" opposite the wick, with the stop beyond the wick. Pin bars tend to mean the most at a well-defined daily level with clear trend context.
Engulfing Reversal
An engulfing candle's body fully covers the prior candle's body, bullish after a down move, bearish after an up move, reflecting a decisive momentum shift. Traders often enter on the close of the engulfing candle and place the stop beyond the engulfed candle's extreme. Engulfing patterns inside consolidation are less reliable and should be filtered with structure and level context. Our guide to reversal patterns goes further.
Inside Bar Breakout
An inside bar sits entirely within the prior candle's range, reflecting compressed volatility before a directional expansion. Typical execution places orders above and below the inside bar, enters on the break, and keeps the stop on the opposite side. Inside bars often work best as continuation patterns in a trend, marking a pause inside the move.
[[aa-cta]]
Trade Price Action on Your Terms
Native TradingView charting (B2PRIME is an official Platinum Partner), plus cTrader and B2TRADER, with transparent RAW pricing starting at $2.50 per lot per side.
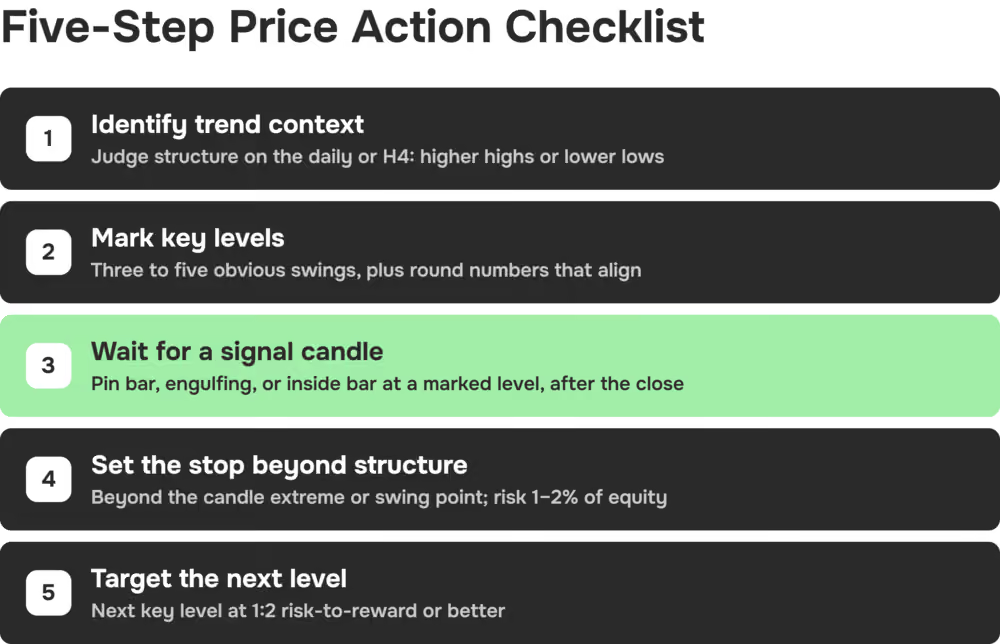
The five steps below run in a fixed order, which is what makes structure, levels, and candles work as one trading system. Skip a step, and you are trading a level with no trigger, or a trigger with no trend behind it. Keep the sequence in your written trading plan so it holds up in a fast session.
Identify trend context. On the daily or H4, mark the last two swing highs and swing lows: higher highs with higher lows is an uptrend; lower highs with lower lows is a downtrend. Beginners are usually better off trading with that direction until their own read is consistent.
Mark key levels. Draw the most obvious higher-timeframe swings and add round numbers only when they align with those swings, and keep it to three to five levels, because a crowded chart makes you hesitate at the entry.
Wait for a signal candle. At a marked level, wait for a pin bar, engulfing, or inside bar and act only after the candle closes. No signal means no trade.
Set the stop beyond structure. Place the stop loss beyond the signal candle's extreme or the nearest swing point, whichever is further. Size the position so that this stop costs no more than 1–2% of equity.
Target the next level. Set the take-profit at the next key level and look for at least 1:2 risk-to-reward. If you take partial profit at 1:1, trail the rest behind structure.
These steps improve consistency; they do not guarantee outcomes, and any trade can still fail.
Trade Price Action With B2PRIME
Trading opportunities from price action are only as useful as the execution behind them. B2PRIME is a multi-regulated broker with neutral tier-1 execution that targets low latency (around 7 milliseconds on average), though fill speed varies with market conditions and connectivity.
As an official TradingView Platinum Partner, it lets a trader apply the concepts above on TradingView charts with direct execution. Its unified account covers forex, gold and metals, indices, commodities, Crypto Spot, and Crypto Perpetual Futures in one balance.
Pricing is transparent: the RAW account is $2.50 per lot per side against an industry average of around $3.50, though lower costs reduce the break-even threshold rather than making a strategy profitable on their own.
[[aa-disclaimer]]
CFDs are complex instruments and come with a high risk of losing money rapidly due to leverage. You should consider whether you understand how CFDs work and whether you can afford to take the high risk of losing your money. Crypto CFDs carry additional risks due to the high volatility of the underlying assets.
This content is for informational and educational purposes only and does not constitute investment advice or a personal recommendation. B2PRIME (B2B Prime Services EU Ltd) is authorized and regulated by the Cyprus Securities and Exchange Commission (CySEC), license no. 370/18. See also Investopedia's introductions toprice action tradingand thecandlestick.
[[/a]]
[[aa-faq]]
FAQs about Price Action Trading
Does price action work on one-minute charts?
Yes, price action principles apply to all timeframes, but day trading on one-minute charts contains more noise and demands faster short-term decisions. Many traders progress faster on the H1 or H4 used for swing trading, where patterns are clearer, and there is more time to validate context before acting.
Is volume essential for price action analysis?
Volume can add confirmation, but it is not essential, especially in forex, where there is no centralized volume and many traders focus on pure price behavior. Prioritize structure and level reactions first, then add volume where reliable data is available.
How many markets should a price action trader watch?
Starting with two or three markets you can follow consistently, for example EUR/USD, gold, and a major index, helps build pattern recognition without diluting attention. Expanding to more markets is easier once the routine is consistent.
Can price action be combined with indicators?
Yes. A professional trader may read structure and levels first, then use a single indicator such as a moving average for trend context. The key is that the indicator supports the price read rather than replacing it, so the chart stays clean and the decision stays with price.
[[/a]]
Connect with Our Experts
Our team is equipped to provide solutions precisely to your requirements. Let's explore your options and discuss how we can support your objectives


.svg)