Oops! Something went wrong while submitting the form.
Notice: It looks like you are visiting us from United Arab Emirates or have selected it as your residency location.
For accurate information and services under the correct licensed entity, please visit the appropriate section of our website. For more information view Regulatory Information
For accurate information and services under the correct licensed entity, please visit the appropriate section of our website. For more information view Regulatory Information
For educational purposes only, not investment advice.
A forex trading strategy is selection logic that tells a trader which setup applies today and which to leave alone. The choice depends on the session, what the higher-timeframe structure is doing, and what the account can actually execute.
This guide is written for traders who already know the setups and want a basis for choosing between them on a given day.
[[aa-key-takeaways]]
Key Takeaways
Effective forex trading strategies usually answer six basics clearly: market condition, directional bias, entry trigger, stop placement, profit target, and risk per trade.
Top-down analysis can help you align forex trading strategies with higher-timeframe structure before using lower charts for more precise entries.
Session-based forex trading strategies often work differently because the Asian range, London open, and New York open can each produce distinct price action setups.
Price action forex trading strategies often focus on break of structure, change of character, order blocks, and fair value gaps rather than lagging indicators.
When comparing forex trading strategies, win rate alone can mislead you because expectancy depends on risk-reward, exposure control, and disciplined backtesting before live execution.
[[/a]]
[[aa-cta]]
Test Session-Based Setups on a Demo First
Practice Asian-range sweeps, London breaks, and New York continuations on B2PRIME's platforms before committing live capital.
A strategy stops being a habit once its rules are written down before the trade, and there is a reason to prefer this setup over the others today.
The Six Components Every Functional Strategy Must Answer
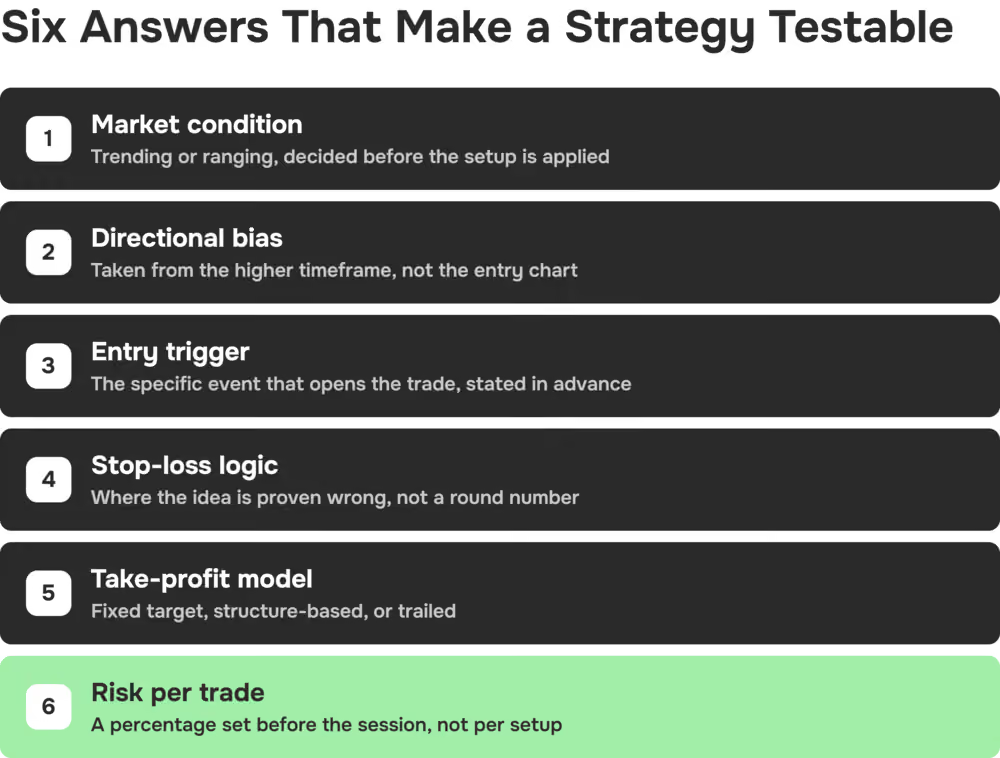
Six answers make a strategy testable: market condition, directional bias, entry trigger, stop-loss logic, take-profit model, and risk percentage per trade. The first one decides the rest, since a trending market suits trend following and a ranging one suits range trading.
The take-profit model can be a fixed level, take-profit orders staged at structure, or a trailing stop. If any one of the six is vague, the strategy is hard to test, repeat, or improve, no matter how good the underlying pattern looks.
Risk management sits inside that list. The percentage risked per trade decides whether the other five answers survive a losing run.
Why Price Action Outperforms Indicator-Based Systems
Price action trading is a form of technical analysis. In fast-moving sessions, it may outperform indicator stacks because it reads market structure as it prints, instead of waiting for moving averages such as a 20-period EMA, or an oscillator, to recalculate. It leaves fundamental analysis aside entirely.
Technical indicators can still confirm context, and many traders keep one or two as a secondary filter: MACD for momentum, RSI for overbought and oversold readings, Bollinger Bands for stretch away from the mean. Treated as the primary signal, though, that stack costs the method the speed it was chosen for.
Top-Down Analysis: The Foundation of Price Action Trading
Higher-timeframe bias comes first, because lower-timeframe entries only make sense once weekly and daily structure agree. That order holds throughout: bias, then session, then trigger.
Reading Market Structure on the Daily and Weekly Chart
Reading structure means marking weekly highs, lows, trend legs, and displacement candles. Major currency pairs like EUR/USD, GBP/USD, and USD/JPY show it most clearly, because they carry the bulk of institutional order flow and trader attention.
The Bank for International Settlements' triennial survey puts daily global FX turnover in the trillions of dollars. Levels on major pairs sit in the path of more of that flow than levels on thinly traded crosses such as NZD/JPY, so they hold as reference points more often. Marking them starts with support and resistance levels on the weekly and daily charts.
Drilling to Lower Timeframes for Entry Confirmation
From a daily bias, the process drops into 4H, 1H, and then 15M charts for confirmation. If the daily chart shows a higher low above a key demand zone, the 4H tracks price into that zone, the 1H prints a rejection wick, and the 15M gives the entry trigger once a bullish order block forms.
Lower timeframes refine risk and entry precision while direction stays with the daily chart. A precise 15-minute entry that contradicts the daily bias is not an independent signal.
Session-Based Strategy Selection: Which Setup Fits Which Window
Timing is part of the strategy. Liquidity, volatility, and failure patterns change from session to session. A setup that works at the London open can fail inside the Asian range.
The same structure serves forex day trading, swing trading, and position trading. What changes between them is the timeframe you read the bias on, while the logic underneath stays the same.
Asian Session: Range Identification and Liquidity Sweep Setup
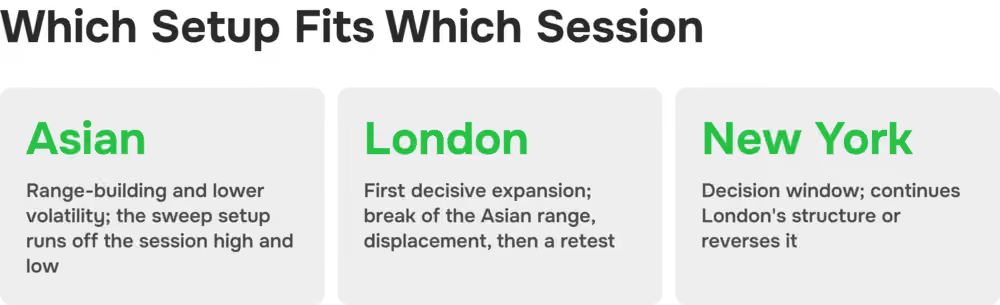
The Asian session is typically a lower-volatility, range-building window. In the sweep setup, price takes out one side of the range, running stops above the high or below the low, before London reacts in the opposite direction.
The setup runs in three steps:
The session high and low, marked before London opens.
A sweep that trades beyond one side of that range.
A clear rejection candle back inside the range before any entry is considered.
London Open Kill Zone: Breakout From the Asian Range
London often delivers the day's first decisive expansion. This breakout strategy centers on a break of the Asian range, a displacement candle confirming momentum, and a pullback to the broken level before entry. Stops typically sit just beyond the broken Asian range, on the side that would invalidate the breakout thesis.
ICT terminology calls this window a kill zone. In execution terms, that means the day's directional move is more likely to start here than in the quiet hours before it.
New York Open Kill Zone: Continuation or Reversal From the London Move
New York is a decision window. If London's structure holds, New York often continues it; if London overextended into a major liquidity pool or higher-timeframe resistance, New York can reverse it instead.
A hypothetical long position from a London breakout enters at 1.0850 with a stop at 1.0820, 30 pips of risk, and a 1:3 target at 1.0940. It nets 90 pips if New York confirms the move, and loses 30 pips if New York rejects London's high. A short position from a failed high works the same way in reverse.
The entry is identical in both cases; the next session decides which way it resolves. This example is illustrative and does not represent an actual trade recommendation.
Core Price Action Strategies and When to Use Them
Three setups do most of the work in a price-action approach: order block retests, break-of-structure and change-of-character signals, and fair value gap fills. Each one needs a different market condition to make sense, whether that is breakout trading into expansion or mean reversion back to an average. The sections below walk through the mechanics of each one. The price action toolkit underneath them is the same: candlestick patterns, level mapping, and position sizing.
Order Block Retest Entries
An order block is the last down-close (or up-close) candle before a strong displacement move in the opposite direction, read as a proxy for where institutional orders likely accumulated. Academic research on institutional order flow supports the underlying premise, since large orders leave detectable footprints in price and volume.
In practice, the sequence is a retest of the block after displacement, then a reaction inside it such as a wick rejection or a small reversal candle, with the stop beyond the block's far edge.
Break of Structure and Change of Character Signals
Break of structure (BOS) and change of character (ChoCh) are related but distinct. A BOS confirms continuation when price closes beyond a prior swing high in an uptrend, reinforcing the existing trend. In a downtrend, the mirror applies: price closes beyond the prior swing low. A ChoCh warns that control may be shifting, with price failing to make a new high and instead breaking a prior swing low.
One rule separates a real signal from noise: the candle body has to close beyond the swing point. A wick that pokes through and closes back inside has not broken anything, and wick-only entries are the ones that false breakouts catch.
Fair Value Gap Fills as Precision Entry Tools
A fair value gap (FVG) is a price imbalance left behind by a strong displacement move, visible as a gap between candle wicks on the chart. It can work as a precision entry tool once directional bias, session timing, and prior displacement are already in place.
A bullish displacement leaves a gap between 1.0900 and 1.0915. A trader might work the midpoint at 1.0907, with the stop beyond the impulse leg's origin and the target at the next external liquidity pool. This is a schematic illustration, not a signal to replicate.
Win Rate vs. Risk-Reward Ratio: What Actually Determines Profitability
Expectancy determines whether a strategy survives over many trades, and win rate is only one input. Two hypothetical strategies show why. Strategy A wins 70% of trades at a 1:0.5 risk-reward ratio; Strategy B wins 40% at 1:3.
Over 100 trades risking 1 unit each, and before any costs, Strategy A nets roughly 70 × 0.5 − 30 × 1 = 5 units, while Strategy B nets roughly 40 × 3 − 60 × 1 = 60 units. The higher win rate produces the weaker result, purely because of how the reward side is structured.
Past performance is not indicative of future results; this is a simplified expectancy illustration, not a trading recommendation.
Trading costs erode this expectancy further. At an indicative $5 round-trip commission against $7, a strategy trading 100 times carries a $200 difference in cost alone, before spread. The same expectancy maths needs re-running with real cost inputs from the broker a trader actually uses.
Positions held across sessions add swap, which reflects the interest rate differential between the two currencies in the pair. It runs against the position as often as it runs with it, and harvesting it deliberately is a carry trade rather than a price action strategy.
How to Backtest a Price Action Strategy Before Risking Live Capital
Backtesting turns rules into a record that belongs in the trading plan alongside the rules themselves. A trader's memory of "how it usually goes" is a poor substitute for a logged sample, and price action rules get tested before they get funded.
A manual workflow covers six steps:
The pairs to test, over a fixed date range.
Session windows marked on every chart.
A tag for the setup that triggered: sweep, BOS, FVG, and so on.
Each outcome recorded in R multiples.
Simulated results kept separate from live trading experience.
The date range, sample size, and whether figures are gross or net of costs.
Simulated or hypothetical performance results have inherent limitations and do not represent actual trading; results may differ materially from live conditions, and past performance is not indicative of future results.
Choose a Platform Your Strategy Can Actually Execute On
Strategy quality and execution quality are linked. A precise London kill-zone entry can fail operationally if charting tools, order types, or latency do not match what the strategy demands.
Requirements differ by method. TradingView provides charting depth, session marking, and multi-timeframe work, while cTrader shows depth of market and enables one-click entries. B2TRADER covers the account itself on web and mobile, which is where a trader working several session windows a day checks exposure between trades.
The platform decides the workflow; the entity holding the account decides the rulebook. B2PRIME's RAW account carries per-side pricing across all three platforms, and its other account tiers differ mainly in how commission and spread are structured.
Test Your Price Action Setups on a Demo Before Going Live
The sequence runs in one direction: higher-timeframe bias, then the session that fits the setup, then the trigger. Risk is defined before entry, and the whole chain gets tested on the platform that will execute it. A sound framework can still fail at that last step, for operational reasons that have nothing to do with the analysis.
B2PRIME's demo environment runs that chain on live pricing without live risk, from the Asian sweep through the London break to New York confirmation, before a trader decides whether the strategy and the execution conditions fit together.
[[aa-cta]]
From Analysis to Execution, on One Platform
Mark sessions, confirm structure, and execute kill-zone setups with TradingView, cTrader, or B2TRADER access on a single account.
CFDs are complex instruments and come with a high risk of rapid losses due to leverage. You should consider whether you understand how CFDs work and whether you can afford to take the high risk of losing your money. Crypto CFDs carry additional risks due to the high volatility of the underlying assets.
This content is for informational and educational purposes only and does not constitute investment advice or a personal recommendation. B2PRIME (B2B Prime Services EU Ltd) is authorized and regulated by the Cyprus Securities and Exchange Commission (CySEC), license no. 370/18.
[[/a]]
[[aa-faq]]
FAQs about Forex Trading Strategies
What is price action trading in forex?
Price action trading is a forex strategy that reads raw price movement, market structure, and key levels instead of relying mainly on lagging indicators. It may help you align entries with session liquidity, especially around Asian range sweeps, London breaks, and New York continuation or reversal windows.
Which forex strategy framework fits different market sessions?
A practical framework starts with higher timeframe bias, then matches setups to the session that typically provides the liquidity your model needs. Range traders often focus on Asia, while breakout or continuation traders may prefer the London open and New York overlap.
How do I create a forex trading strategy that actually works?
A working strategy defines six rules: market condition, directional bias, entry trigger, stop placement, take-profit logic, and risk per trade. If any rule is vague, the strategy will be difficult to test, repeat, and improve.
How do I backtest a forex trading strategy?
Backtesting means applying your forex strategy rules to historical charts, then logging entry quality, stop distance, target logic, and session timing. Many traders review at least several dozen setups before going live, because one clean week rarely shows how a model behaves across different conditions.
What platform features matter for forex trading strategies?
Execution speed, spread stability, session tools, and clear risk controls matter because scalping, session breakouts, and order block retests need precise fills. TradingView integration may help with kill-zone planning, while cTrader can suit traders who want depth of market and flexible order management. A demo account is the best place to see whether a platform holds up under the strategy's timing.
[[/a]]
Connect with Our Experts
Our team is equipped to provide solutions precisely to your requirements. Let's explore your options and discuss how we can support your objectives



.svg)