Oops! Something went wrong while submitting the form.
Notice: It looks like you are visiting us from United Arab Emirates or have selected it as your residency location.
For accurate information and services under the correct licensed entity, please visit the appropriate section of our website. For more information view Regulatory Information
For accurate information and services under the correct licensed entity, please visit the appropriate section of our website. For more information view Regulatory Information
False breakouts can be one of the most frustrating hurdles that traders need to deal with if they want to trade the markets more effectively. False breakouts can lead to losses and unwanted frustration, as they can confuse even the most experienced traders and leave them wondering how a given trend suddenly disappeared in a moment.
In this article, we look at the main early warning signs of false breakouts, the more common causes and some tools traders sometimes use to manage the impact of false breakouts.
[[aa-key-takeaways]]
Key Takeaways
When the price breaches a support or resistance level and quickly reverses direction, this can result in a false breakout.
Volume analysis, candlestick patterns, and moving averages are commonly used when trying to spot a potential false breakout.
To help reduce the risk of false breakouts, wait for confirmation, use stop-loss orders, and look over all breadth indicators including the market profile.
[[/a]]
What is a Breakout?
In technical analysis, a breakout occurs when an asset's price moves above or below a previous (yet well-established) support and resistance level. Breakouts typically indicate a potential for a significant price move. Traders use these levels to help anticipate direction of the price, including horizontal resistance & support lines, or trendlines.
When a breakout occurs, it's often seen by traders as a possible sign that a new trend is forming in the market; for instance, if the price breaks above a resistance level, it is perceived as a signal that the price could continue to go up, thus starting a bullish trend. On the contrary, when the price breaks below a support level, traders may view this as potentially signalling the start of a bearish trend.
Breakouts are often considered by trend-following traders as a potential entry point, as they may assume the trend will continue in the breakout direction, building on the momentum.
Breakouts are an important part of many trading strategies, particularly trend-following systems. However, not every breakout leads to a continuation in price movement — this is where the mix-up happens with false breakouts, which can lead traders to lose sight of the actual price action.
[[aa-fast-fact]]
Fast Fact
False breakouts can occur due to market manipulation, sudden news events, or low liquidity, making them difficult to predict even when the traders use different tools and strategies.
[[/a]]
How False Breakouts Can Occur?
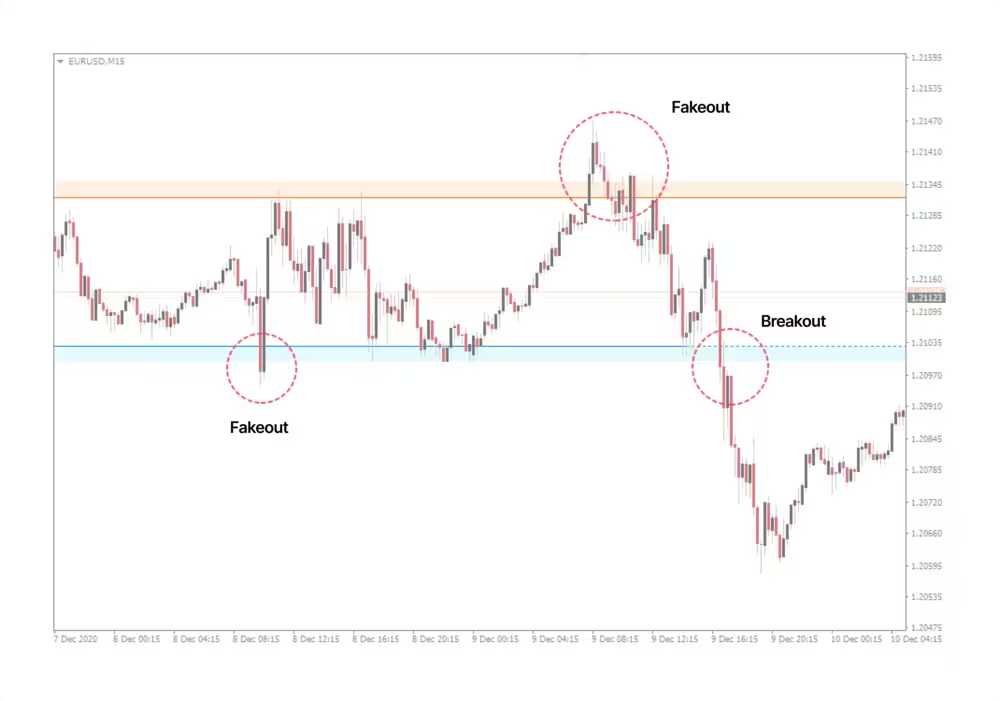
A false breakout occurs when a price breaks above an important level of resistance or below a support level, only to ultimately reverse and remain within the previous price range.
A false breakout can catch traders who have entered the market (and gained false hope) on the breakout, where the price moves immediately against them, which may result in a loss on that trade.
False breakouts can occur for various reasons, and understanding these reasons may help traders recognise situations where a false breakout can happen.
Market Manipulation
Market manipulation is one of the more nefarious causes of false breakouts. In very liquid markets, large players or institutions may sometimes influence price movements above resistance or below support, thereby triggering stop-loss orders and prompting smaller traders to either enter or exit their positions.
After this has been achieved, the large players can reverse the price and trap the traders in their positions, which may work in their favour if the price moves in the opposite direction.
Sudden News Events
Surprising news or events may trigger short-term price action that appears to have penetrated a support or resistance level, but the market may later view the event or news as not sufficiently important to support a new long-term trend.
For example, a news announcement may, in the moment, cause a price to push above a resistance point, and as the market fully interprets the implications of the news, the price recedes back into the previous range. If traders do not consider the news in its wider context, this may result in what looks like a false breakout.
Low Liquidity
Liquidity refers to the speed and efficiency with which an asset can be bought or sold without affecting its price. Low liquidity can sometimes make prices more prone to distortion or sharper price level change.
False breakouts can occur if there are not enough buyers or sellers to sustain the breakout level, and the price reverts once the tidal wave of buying or selling subsides. In these instances, they can be in and out before what was a breakout is duly registered in history.
Additionally, traders can end up getting caught trying to enter shorts or longs that then immediately return to their original position.
Market Noise
At times, price movements that break through support or resistance levels are actually noise — i.e., small, random fluctuations that may give an impression to the trader that a breakout is taking place. This is especially true for volatile markets, where you may see a spike up or down only to see the price revert back to its previous range.
In short, these random movements may appear as false breakouts, especially when traders enter their position on the initial movement without waiting for subsequent confirmation.
False Confidence from Low-Volume Moves
A breakout with low volume may indicate weaker market conviction behind the price movement. If you get a breakout with low volume, there is less participation, and the breakout may be seen as less reliable by some traders.
Client engagement that supports the breakout is often considered important, as trading volume is often used by traders assess whether a breakout might be sustained. A breakout may not be sustained with low volume and may result in a false breakout.
Signs of a False Breakout
Recognising a false breakout early may help traders reduce the risk of losses. Instead of being misled by false signals and entering into positions, traders can learn to recognise possible signs that may help them avoid entering a losing position following a failed breakout and help them better recognise when a breakout may be genuine.
The following are some signs to watch for that may indicate a false breakout.
Volume Anomalies
Volume is often used by traders as an additional signal in breakout trading. A breakout may sometimes be accompanied by an increase in volume, which often indicates that the move is being supported by broader market participation.
If a breakout occurs, however, with low or volatile volume, this may suggest that the price move has limited strenght. This low volume can indicate that there is little commitment from traders; thus, so the breakout may turn out to be a false move with limited duration.
The same applies to the establishment, and then it starts to fall off again, as some traders may believe that the new price level may not be sustainable, leading to an immediate swing reversal and skipping an entire legitimate breakout option.
Weak Follow-Through
Ideally, after a breakout, the price will hold at its new level, which may suggest that the trend could continue. In the case of a false breakout, there is often weak follow-through, where the price stops moving or quickly reverts back into the previous range.
If momentum does not build upon the breakout or the price quickly returns to the previous range, this may indicate a failed breakout. A strong breakout is often associated with some momentum surrounding it, and the lack of continuation may suggest that the breakout was not valid in the context of broader market development. Traders may find themselves stuck in a losing position.
To help manage this risk, breakout traders should look for additional signals suggesting the breakout may hold. If traders see that the price does not hold its move, then it may be best for them to step back from the market and wait for another possible signal.
Price Action Reversal
A classic indication of a false breakout is when a price is said to have broken a key support or resistance level and then quickly returns to its previous range. This action often may suggest the breakout was not genuine and that a new trend may not be forming.
The price action of the move traversing the key level is short-lived, and the price quickly returns to the prior range, leading many traders to believe it was truly a breakout.
For price action traders, it is a common signal to watch, especially in sideways markets with limited ranges and numerous false breakouts. Being able to quickly identify the return on price may help traders avoid being caught in an unfavorable position.
Strategies to Avoid Getting Trapped
False breakouts are quite tricky, and by getting trapped in one, you may face losses. Multiple techniques are often used to check the validity of a breakout, allowing you to trade based on additional market signals .
Here are some common strategies to help reduce the chances of encountering false breakouts.
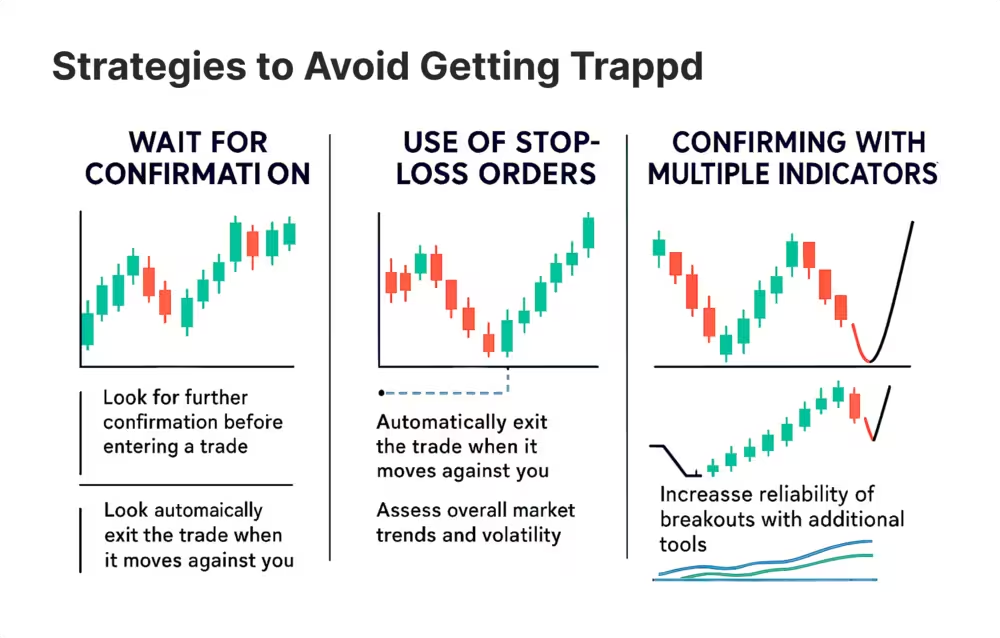
Wait for Confirmation
One of the most important rules of breakout trading is to look for additional confirmation before entering a trade. The fact that the price is beyond a key support or resistance level does not mean it will continue. False breakouts can happen very quickly, but are often followed by a reversal, which may leave traders with a losing position.
Confirmation can take many different forms; any additional price action or volume can be a form of confirmation. When trading a breakout, it is important to look for a candle close beyond that level which may suggest the market is moving in that direction.
If volume is rising alongside the breakout, some traders may see this as a sign that the move could continue. However, if the volume is lower or mixed, this may indicate that the breakout could be weaker; thus, waiting for confirmation may help reduce the chances of entering a false breakout.
Use of Stop-Loss Orders
Even with the best plan in place, sometimes the breakout can fail, leading to a failed breakout. For this reason, stop-loss orders are often considered important in price action trading. A stop-loss order is an automatic order to exit the trade if the price moves against you by a particular amount, which may help limit potential losses.
You can set your stop-loss just above or below the key level, such as the support or resistance level that was just broken, to help reduce exposure to a larger reversal if the breakout fails. The key here is that you are managing your risk. You are trying to manage the impact of rapid price reversals after a false trade breakout by using stop-loss orders.
Monitoring Market Sentiment
The overall market sentiment may influence the strength of the breakout. Rarely will a breakout reach its full potential if the overall market is affected by events such as news or economic reports that undermine its legitimacy.
For instance, low-volatility breakouts may sometimes appear as false breakouts compared to breakouts in high-volatility times or periods when sentiment is strong.
As a trader, it is useful to stay informed about developments in the overall market that could impact your trading plan. For example, a breakout in trending markets may last longer compared to false breakouts in range-bound markets. Thus, understanding the market structure may help traders assess whether a breakout might hold or reverse.
Confirming with Multiple Indicators
Using a single indicator may sometimes mislead traders about the opportunities presented by false breakouts. A commonly used approach to identifying breakouts is to use multiple indicators to confirm the breakout.
Multiple tools, such as the Relative Strength Index (RSI), Moving Average Convergence Divergence (MACD), and trendlines, may provide a more comprehensive picture of the market.
A false breakout, where the RSI indicates overbought or oversold characteristics, may suggest that the breakout is too extreme to follow.
The same can be said for the MACD if the MACD lines are not showing the anticipated bullish or bearish momentum well.
Using these tools to confirm the breakouts may help traders evaluate breakouts setups and potentially reduce trades based on false breakouts.
Tools and Indicators to Identify False Breakouts
Identifying false breakouts can be an important step in reducing exposure to potentially harmful price fluctuations that may lead to losses. Traders can incorporate various factors and indicators to assess whether the breakout appears genuine or may reverse.
Below are some commonly usedl tools for identifying false breakouts.
Volume Analysis
Volume is one of the indicators used in breakout trading. A genuine breakout is often accompanied by higher volume, suggesting that market participants may be supporting the price move. When price moves break key chart levels on low or sparse volume, it may suggest weaker participation and the possibility of a false breakout.
For example, if the price breaks past a key resistance level but shows low volume, it may suggest that there is limited momentum to sustain the move. If volume spikes but then dies out quickly, this could point to a weaker breakout or short-lived price move.
Candlestick Patterns
Candlestick patterns can provide useful insights into market emotions, but may sometimes indicate potential false breakouts. There are several patterns to observe, such as the engulfing pattern, where a larger candlestick completely takes out a smaller candlestick.
This pattern may signal a potential reversal, especially after a breakout, since the price may quickly reverse back into the range. In the same vein, a doji (which follows a breakout) indicates indecision in the market and can act as a warning sign for some traders.
After a breakout, the doji may suggest the price could return to the range as momentum dissipates. The pin bar is another noteworthy candlestick pattern to monitor.
A pin bar has a long wick and can represent a rejection of the price. If it is formed near an important support or resistance level after a breakout, it may suggest that the market is rejecting the breakout and that a reversal could occur.
Moving Averages and Trendlines
Moving averages and trendlines are commonly used tools to assess the strength of a breakout. A moving average smooths price data to provide an indication of the market's overall direction.
If you have a breakout, but price does not stay above a meaningful moving average (i.e., the 50-period MA or 200-period MA), it could suggest that the breakout is weaker and not aligned with the broader market trend, and it could lose a momentum.
Trendlines can also provide additional context on a breakout. If the price breaks a trendline and then fails to stay above it, promptly reversing back into the previous range, it may suggest the breakout was not sustained.
Conclusion
False breakout patterns are one of the most deceptive traps in trading, but with the right tools and strategies, traders may reduce chances of getting caught. By confirming breakouts with volume, candlestick patterns, and technical indicators, traders may be better equipped to analyse market movements and make more informed decisions. Remember, patience and proper risk management are often viewed as important elements of long-term trading.
[[aa-faq]]
FAQ
What is a false breakout?
A false breakout happens when the price temporarily breaks through a key support or resistance level but quickly returns to its original range, which may mislead some traders.
How can I avoid false breakouts?
Some traders wait for additional confirmation from volume, use stop-loss orders, and monitor broader market conditions when assessing breakoutss.
What role do candlestick patterns play in false breakouts?
Candlestick patterns, such as the engulfing pattern or doji, may reflect market indecision or a potential reversal, which some traders use when assessing potential false breakouts.
Can moving averages help identify false breakouts?
Moving averages are sometimes used by traders to analyze whether breakout aligns with the broader market trend.
[[/a]]
Connect with Our Experts
Our team is equipped to provide solutions precisely to your requirements. Let's explore your options and discuss how we can support your objectives


.svg)


.avif)
.avif)

