Oops! Something went wrong while submitting the form.
Notice: It looks like you are visiting us from United Arab Emirates or have selected it as your residency location.
For accurate information and services under the correct licensed entity, please visit the appropriate section of our website. For more information view Regulatory Information
For accurate information and services under the correct licensed entity, please visit the appropriate section of our website. For more information view Regulatory Information
Markets are like stories — and sometimes, the plot twists. A solid uptrend can suddenly crumble, or a downtrend can surge into recovery. These moments, known as market reversals, are where some traders may find their potential edge. But analysing them isn’t guesswork — it’s a blend of psychology, approach, and timing.
In this guide, we’ll break down the commonly considered signals, patterns, and tools traders may use to understand trading around reversals, to help you make sense of those potential turning points in the market.
[[aa-key-takeaways]]
Key Takeaways
Reversal trading may involve identifying the early signs of a potential reversal like momentum loss, divergence, and overbought/oversold conditions.
RSI, MACD, Bollinger Bands, etc. may help assess when a trend is in a loss of momentum stage.
Candlestick patterns like hammers, engulfing candles, and morning stars visually suggest potential changing market psychology.
[[/a]]
What Is a Market Reversal?
A market reversal is one of those events in trading when it can feel like the earth has shifted under your feet. It may occur when an asset that has been moving in one direction suddenly moves in the opposite direction — a steady uptrend occurs to a downtrend or vice versa.
Market reversals can represent the transitional phase of new higher or lower price action, and may present potential trading opportunities if identified early, however misidentifying reversals can lead to significant losses.
However, not every price dip or bounce is a market reversal. Sometimes it is a price breather before continuing in the same direction, also called a punt back.
The difficulty lies in recognising the difference between a genuine market direction change and a transient price level pause. Developing this skill can take time and experience; even experienced traders frequently encounter false signals.
Reversals can be caused by an infinite number of factors, including changes in economic data, unexpected news, or shifts in trader opinion. Sometimes, you may notice certail characteristics, such as a loss of momentum, high volume, or price patterns that are indicative of exhaustion. At other times, a reversal may seem sudden and begin unexpectedly until the pattern is revealed during hindsight, when viewing the whole sequence.
[[aa-fast-fact]]
Fast Fact
RSI indicator, developed in 1978, remains one of the widely used tools for identifying momentum divergences in modern trading.
[[/a]]
Signs of an Upcoming Reversal
In the realm of reversal trading, considering when a market trend may be nearing a change can be relevant getting a trade setup earlier or avoiding late timeframe decisions. There is no perfect method for pricing action, but traders often look to a combination of price action patterns, indicators, and support and resistance to assess potential change in trend.
Here are some of the most common and significant reversal signals that traders can look for.
Loss of Momentum
A potential diminishing momentum in price action may be one of the commonly earliest observed signals that a trend might be on the verge of reversal. In a strong uptrend, price movement is relatively smooth and decisive.
However, as the trend begins to slow (often with smaller candles, lower volume, and less follow-through), this may indicate that the trend is losing strength. For reversal traders, this can be prospective hint that a trend change may begin to happen.
Momentum indicators, such as RSI or MACD, may help assess these shifts. If they start to diverge from the price action, they may serve as potential early-warning reversal signals and may support reversal approach.
Price Exhaustion and Overbought/Oversold Conditions
Often, markets reach price exhaustion, the limit of the current price move. Exhaustion happens when the market's price trend (bullish trend or a bearish run) continues unabated for some length of time.
Indicators (RSI or Stochastic Oscillator) may provide the signals related to overbought or oversold market sentiment and can help assess price reversal.
During these price extremes, the price may grind around key support or resistance levels, providing an prospective setting up for a support and resistance flip; previous resistance turns to support, or previous support turns to resistance.
Support resistance flips can sometimes denote the beginning of a new trend and may offer setups some reversal traders consider for a potential change in direction.
Divergence Between Price and Indicators
Divergence is one of the most commonly used technical indicators to asses a potential trend change; when the price movement tells one story, and the indicator tells another.
For example, a stock may begin to make higher highs, while the RSI is showing lower highs. This may be a bearish divergence that may suggest a bullish trend is losing momentum, which may precede a bearish move.
On the other hand, bullish reversal setups may also suggest that the price continues to make lower lows, but momentum indicators are beginning to change direction and trending upward.
The identification of this type of reversal signal, just before a market trend change, could provide traders with an opportunity to consider position themselves ahead of the potential trend shift.
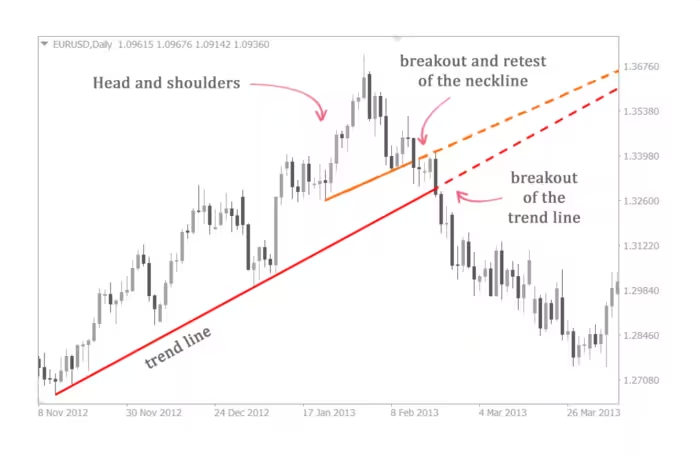
Key Reversal Candlestick Patterns
Candlestick patterns are one of the most visual and commonly used tools traders may utilise for reversal trading. Some patterns may represent reversal patterns that could exhibit high reliability when considering price action and the significance of key support and resistance levels. The hammer, shooting star, engulfing candles and Doji may suggest that the battle between buyers and sellers might be reaching its limits.
These price action patterns may have even more significance when they are presented alongside a support and resistance flip, or a significant increase in volume, which may support the prospective intent to reverse.
An example would be a bullish reversal pattern forming in a strong area of support, following a longer downtrend, which may signal a potential start of a new trend—a possible trade for stock or asset traders that may consider a change in trend.
Reversal Candlestick Patterns
Few, if any, tools provide as simple and widely accepted a possible signal for a potential change in trend as candlestick patterns. Candlestick patterns do more than give price behavior; they could also provide insight into the psychology of market movement, showing which side has control, which side is beginning to give way, and whether momentum is shifting.
For many reversal traders, candlesticks are the first place they turn to when scanning for potential signs of early reversals. Within a trading strategy, candlestick formations may offer real-time stories about the behaviors of market participants and hints of the shifts in market sentiment.
Although they never promise a trend reversal, they may suggest, when combined with other factors, when the current trend might be running out of steam, and a new trend might be ready to start.
Hammer and Hanging Man
At a glance, the hammer and hanging man appear similar. Both candles feature small real bodies near the top of the candle and long lower shadows, but they have very different meanings based on their location.
A hammer forms after a downtrend and potentially proposing a bullish reversal. The lower wick may indicate how sellers lost their grip on the candle, allowing buyers to come back in before the close. It may suggest the potential beginning of a bullish trend, or a trend change in the asset altogether.
A hanging man forms after an uptrend. The candle closes near its high, but the shadow could indicate some selling pressure; if confirmed, then there may be signs of a reversal. For reversal traders, context is crucial, especially if the pattern occurs near a support level.
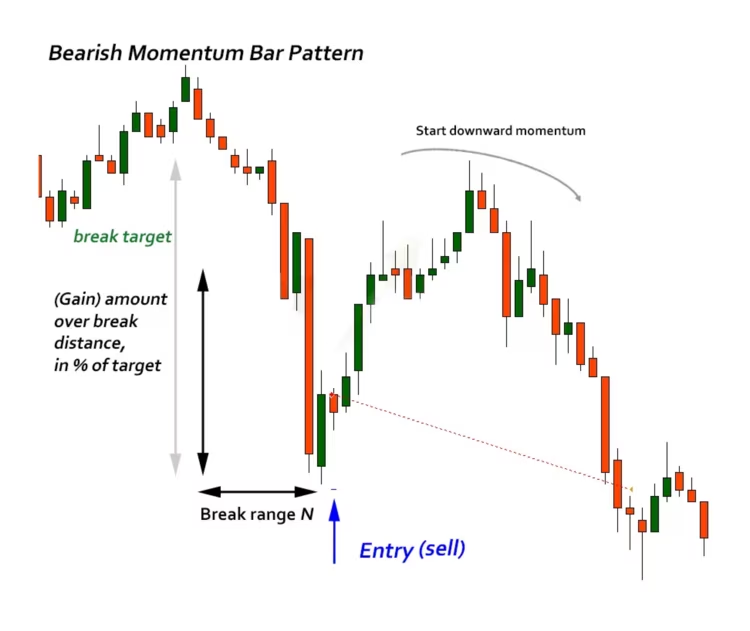
Engulfing Patterns
Engulfing patterns are one of the most commonly observed price action patterns and may occur at turning points in the market trend. A bullish engulfing pattern often occurs at the end of a downtrend. A large green candle engulfs the previous red candle.
This may suggest that buyers are starting to reclaim control, which could signal a shift in trend. It's a potential indication of increasing buying interest and a possible bullish reversal.
A bearish engulfing pattern occurs after a rally. Where a red candle engulfs the previous small green candle. This may indicate that sellers are stepping in and overcoming the previous momentum. Engulfing patterns may be more relevant when they occur near substantial support and resistance levels or after a prolonged one-sided price movement.
Engulfing candles may help traders to assess shifts in sentiment ahead before the broader market moves, especially when trading stocks, Forex, or cryptocurrencies.
Morning Star and Evening Star
Morning stars and evening stars are three-candle potential reversal patterns that may signal a change in trend. A morning star may form after a downtrend and can consist of a large bearish candle, a smaller candle of indecision (many times a doji or spinning top), and a big bullish candle that closes well into the range of the first. In this case, the candles could sometimes tell a story of diminishing bearish pressure and increasing bullish intent — possible behavior of a bullish reversal.
The evening star is the opposite, and may form after a bullish trend that could consist of a large bullish candle, followed by a candle of indecision, and then finally a big bearish candle. You may usually find this pattern at overextended highs, where buyers may begin to lose enthusiasm.
Also, both structures are often more relevant when they occur near known support or in conjunction with other known trading tactics such as price breaks or volume confirmation.
Doji
The doji is a simple but often considered pattern. The doji occurs when the open and closing prices are almost the same, creating a cross-shaped candle, which, even taken by itself, symbolises indecision in the market. The doji alone is not a distinct reversal signal, but location is everything.
When a doji occurs after a strong trend, particularly at a meaningful support level or resistance level, it may suggest that the trend is losing momentum.
For example, if a doji occurs after a large bullish trend, buyers may be losing control. A doji followed by a strong candle in the opposite direction could serve as a potential early indication of a possible trend reversal.
Variations of the doji include the dragonfly, gravestone, and long-legged doji; all may imply indecision as a group but have additional aspects of a possible reversal.
Tools and Indicators for Reversal Trading
Finding a potential reversal isn't a matter of luck or intuition — it's simply about watching the signs. For many traders, particularly those seeking to identify earlier shifts in the current trend, utilising visual formations in conjunction with commonly used technical indicators can be relevant.
Use the following tools and techniques traders may consider regardless of the asset class — stock, forex, and crypto traders may utilise them in changing market conditions and when prices change unexpectedly.
Moving Averages
Moving averages are widely used in technical analysis because they show a smoother representation of the larger prevailing trend by filtering the daily noise of price action. They may be especially useful when assessing a change in trend.
A common method traders may use is to watch for crossovers of moving averages, for example, when the shorter-term average (such as the 20-day average) crosses the longer-term average (such as the 50-day average).
A bullish crossover (when the shorter average crosses above the longer average) may suggest a potential change from a downtrend into a possible upward trend.
Traders also look at the angle of the moving average line. If a moving average line flattens or begins to reverse, it may suggest a weakening trend and a possible reversal. These events could be particularly significant when combined with other indicators.
Relative Strength Index (RSI) and Stochastic Oscillator
The Relative Strength Index (RSI) and the Stochastic Oscillator are both popular momentum indicators that may help assess whether an asset is potentially overbought or oversold, and where it may reverse.If the RSI is above 70, then the asset may be overbought and could reverse downward. If the RSI is below 30, it may be considered oversold.
Momentum divergence may extend beyond just levels. For example, if the price is hitting new highs while the RSI is forming lower highs, it could suggest dwindling momentum and a potential reversal signal.
On the other hand, a bullish divergence (where price makes lower lows and RSI makes higher lows) could indicate a bounce in the opposite direction.
MACD (Moving Average Convergence Divergence)
Another momentum indicator, the MACD combines moving averages with a signal line. A bullish crossover of the MACD line above the signal line may be one of the commonly watched factors, as it could indicate a potential reversal in the direction of the existing trend.
Traders may pay attention to the MACD histogram for possible clues about momentum shifts. A histogram could suggest that the current moves are losing strength or starting to lose strength, a prospective condition traders may observe for a trend change.
As with any indicator, however, the MACD could be more relevant when used alongside additional technical indicators, for more comprehensive analysis.
Bollinger Bands
Bollinger Bands help measure volatility and can be very useful in assessing price extremes. When the price touches or breaches the bands — and particularly after extended movement — it could suggest unsustainable momentum.
For example, a price rejection at the upper band following an extended bullish trend could help with analysis of possible increased buying pressure, while penetration of the lower band may suggestl selling exhaustion.
Bollinger Bands, without an additional reversal clue (such as divergence or a candle pattern), may be an effective supplement for analysis when considering potential reversals, particularly in high-volatility situations brought on by geopolitical events like wars or unpredictable news.
Volume Analysis
Volume is the sometimes forgotten indicator that may provide context for potential signals. A potential reversal signal, accompanied by high volume, may be stronger than a signal formed during low volume due to low participation.
Volume may also suggest that a recent break has potential and is not just a shallow pullback, if the volume spike happens around a breakout in the opposite direction of the trend.
Spikes in volume may also help with calculations of profit targets, because they may suggest the possible highest areas of interest for buying and selling. For many traders, volume could provide confirmation they consider before entering or exiting a market during periods of volatility.
Conclusion
The market doesn’t whisper — it speaks in patterns, volume, and momentum. Learning to analyse a possible trend change before it’s obvious to everyone else, distinguishes the reactive from the strategic.
Whether you’re analysing candlestick behaviour, cross-checking technical indicators, or watching for price breaks, reversal trading is about timing, discipline, and context. Like any skill, it sharpens with experience, and each chart is another chapter in your learning as a trader.
[[aa-faq]]
FAQ
What is the most reliable candlestick for spotting reversals?
The hammer and engulfing patterns are among the frequently referenced for potential reversal signals, especially near key support or resistance levels, though no pattern is reliable in all market conditions.
Can reversal trading be used in all markets?
Yes. Reversal strategies can be applied across all asset classes, including stocks, forex, crypto, and commodities, however the approach may vary by market conditions.
Is MACD better than RSI for reversal signals?
Both have unique characteristics. RSI can help with momentum shifts; MACD offers insight into trend direction and timing.
Do I need to use volume when trading reversals?
Volume isn’t mandatory, but it may add additional context. High volume during reversals may increase the potential reliability of the signal, though it does not guarantee success..
[[/a]]
Connect with Our Experts
Our team is equipped to provide solutions precisely to your requirements. Let's explore your options and discuss how we can support your objectives


.svg)