Oops! Something went wrong while submitting the form.
Notice: It looks like you are visiting us from United Arab Emirates or have selected it as your residency location.
For accurate information and services under the correct licensed entity, please visit the appropriate section of our website. For more information view Regulatory Information
For accurate information and services under the correct licensed entity, please visit the appropriate section of our website. For more information view Regulatory Information
Imagine the financial markets as a battlefield. Prices surge and retreat like armies in motion, but certain invisible lines seem to hold the ground, stopping price advances or halting dramatic falls. These are support and resistance levels, and they're no coincidence.
From seasoned pros to curious beginners, anyone can enhance their understanding on how these key levels shape price action, signal possible reversals, and define the battlefield of buying and selling, though such knowledge doesn’t guarantee trading success.
[[aa-key-takeaways]]
Key Takeaways
Levels of support and resistance may indicate where prices reverse, stagnate, or break out—crucial information for timing trades.
These critical price levels may be horizontal, trend-dependent, dynamic (such as moving averages), Fibonacci-derived, or psychologically important.
Trading methods like bounce trading, breakouts, and role reversal may provide opportunities to benefit from the market sentiment within these areas, though they also carry risks.
[[/a]]
What Are Support and Resistance?
Support and resistance are two of the most fundamental concepts in technical analysis. They represent key levels where the price of an asset tends to pause, reverse, or consolidate due to a concentration of buying or selling interest.
These levels are more than simple lines on a chart pattern—they are psychological areas defined by market sentiment, historical data, and trader actions.
Support: The Price Floor
Support is a point where a downtrend may pause due to the accumulation of demand. When prices fall, some buyers may be more inclined to enter the market and consider the lower price a deal.
Such purchasing pressure can sometimes invert the downtrend or even lead to a reversal back up. You may think of the support as a “floor” that prices often find difficult to break below.
For instance, if a stock frequently reverses out at the $50 level on dips, the trader might consider $50 as a potential area of support, though this is not assured. The more frequently the level is attained, the more important it can become, catching the attention of both the retail and institutional communities.
Resistance: The Price Ceiling
Resistance is the reverse. It’s a level where uptrends often tend to peak due to increased interest in selling. When the price rises, some investors who purchased at cheaper prices in the past may consider taking profits, and new sellers may view the highest price as a potential level for short-selling or closing positions. In this way, supply can outweigh demand, creating a “ceiling” where prices may struggle to break through.
For example, if an asset reaches the $100 level once or twice without advancing above it, sentiment may begin to view the level as a resistance point. A breakout above the resistance level may sometimes indicate a shift toward bullish sentiment, particularly if it is accompanied by strong volume, but traders should exercise caution as outcomes may vary.
[[aa-fast-fact]]
Fast Fact
The 1.0000 mark in Forex is so psychologically powerful that it often attracts billions in volume—even before any technical indicator confirms it.
[[/a]]
Types of Support and Resistance Levels
Understanding the different types of support and resistance levels is crucial in developing a robust trading plan. From the Forex support lines to stock price level analysis in the stock market, the tool enables traders to identify dominant areas where price movement is most reactive.
Let’s examine the most common types being used in technical analysis.
Horizontal Levels
These are the most popular areas of resistance and support on the price chart. Horizontal lines are the current prices at which the players in the market have all responded equally, by buying at the level of support or by selling at the level of resistance.
These zones are often derived from historical highs and lows, marking key price levels where the asset's price has reversed or consolidated. Many technical traders use horizontal lines to identify support or resistance levels, making them a go-to tool in almost any support and resistance (S&R) strategy.
For example, if a stock price repeatedly bounces off the 1.2000 mark in a Forex trading range, this round number acts as a potential support level. Likewise, a repeated rejection at 1.2500 suggests a firm resistance level. Though not an exact science, such price levels offer strong insight into future price action.
Trendlines
Unlike horizontal levels, trendlines represent diagonal areas of trade that emerge as a result of continuous price movements upward or downward. They join consecutive higher lows in the uptrend or consecutive lows in the downtrend as dynamic areas of resistance or support.
Technicians typically insert such lines to eye-chart the future direction of the market and where the price can potentially reverse. When the price crosses a trendline, it typically indicates a shift in market sentiment, particularly when accompanied by other indicators or spikes in volume.
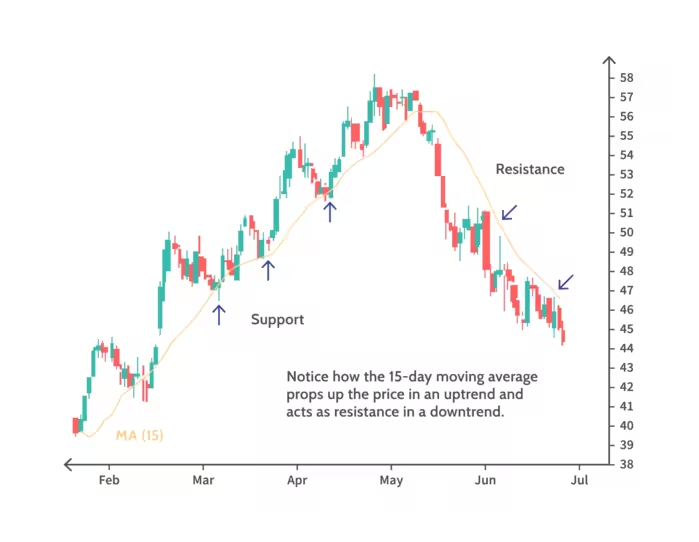
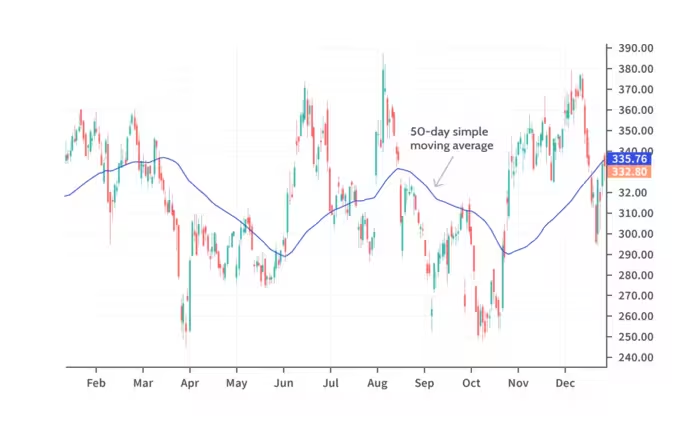
Moving Averages
Moving Averages are common indicators in technical analysis that serve as dynamic lines of resistance and support are the moving averages (MAs). Unlike fixed areas of price, MAs evolve alongside the price in the direction the price has been moving over the specified time horizon—such as the 50-day or 200-day MA.
These popular market-moving averages can act as if they are invisible walls. A rising 50 MA may be a level of support where price declines are met by new buying interest. A downtrending 200 MA may act as a long-term level of resistance where more rallies are halted.
Many traders incorporate MAs into their S&R strategy to smooth out price action and eliminate noise from the charts.
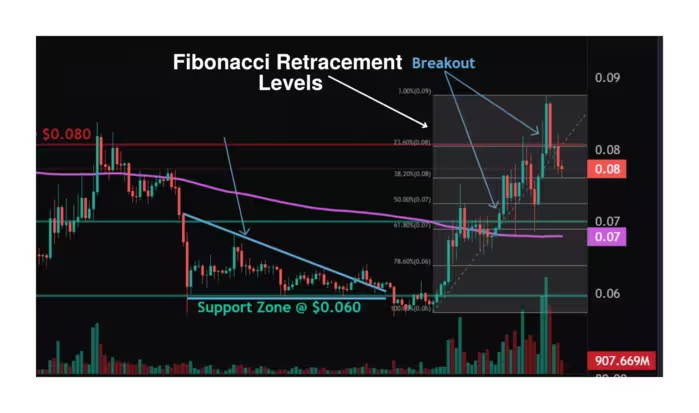
Fibonacci Levels
Fibonacci retracement levels are mathematical ratios used in technical analysis to predict key levels where the price may find support or resistance. Commonly used ratios include 38.2%, 50%, and 61.8%, which are derived from significant peaks and troughs on a price chart.
These levels are beneficial when the market is correcting before continuing a trend. When the price approaches one of these Fibonacci levels, many trading strategies suggest waiting for confirmation before entering a trade.
Although based on numbers, these zones are observed by thousands of traders, creating self-fulfilling support or resistance levels in the financial markets.
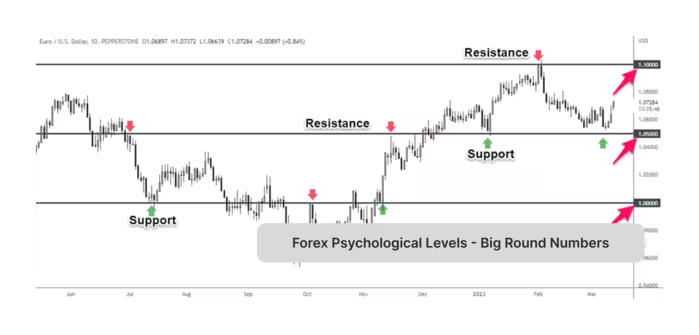
Psychological Levels
Underestimated by inexperienced traders, psychological levels are significant figures, such as 1.0000, 1.0500, or 100. Such levels gain focus as both retail and institutional participants tend to act towards neat figures that are easy to remember. Why do rounded statistics make a difference? Because they're easy and hardwired into human nature.
When the price reaches a figure such as 1.5000, the trader expects a response, and this response in turn may build up a formidable price barrier—either a support level or an area of resistance.
Although these levels don't always align perfectly with technical tools, they often overlap with other indicators, reinforcing their validity in a broader trading strategy.
Common Trading Strategies Using S&R
After discovering your level of resistance and support, comes the aspect of how exactly to trade them. Whether you are a beginner or a seasoned professional, the following methods are commonly used by technical analysts across all financial arenas.
With these methods, the trader may decipher price falls, price breaks, and market sentiment from the actions of market players.
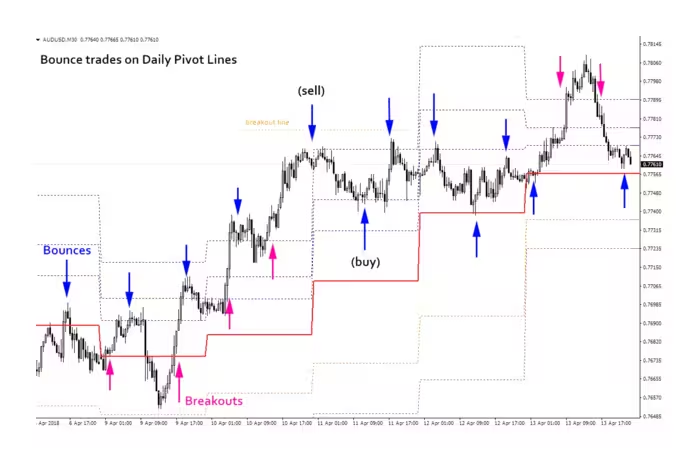
Bounce Trading
One of the simplest methods for trading support and resistance is a Bounce trade. The concept is simple: buy near the area of a support level where descents may often bottom out, and sell near the area of a resistance level where ascents often stall.
This method relies on the assumption that market participants may continue to react to these key levels as they have in the past. For instance, if a currency pair in the Forex market frequently rebounds from the 1.2000 level, traders might consider entering long positions as the price nears that point again. Similarly, short positions might be considered as the price rises toward an established resistance level.
Bounce trades often involve setting close stop-loss locations just beyond the level to manage the risk in the event the price fails to hold, however no trade is without risk.
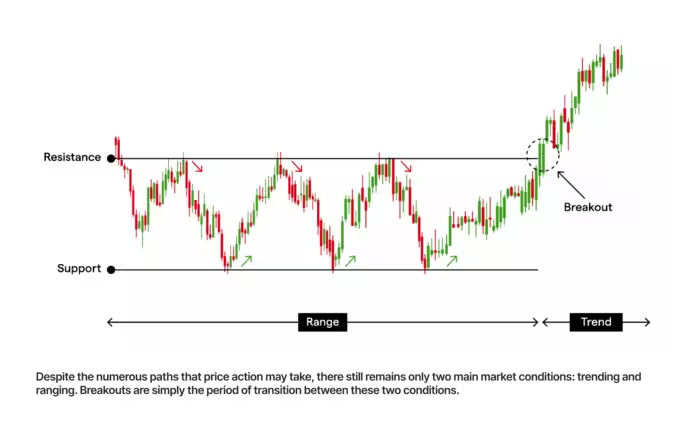
Breakout Trading
While bounce traders expect the levels to hold, breakout traders plan for the price to break through such crucial areas. Such a plan aims to capitalise on potential surges of momentum accompanying breakouts, particularly when volume confirmation is present, though outcomes can vary.
For example, if a currency pair decisively breaks above a long-standing resistance level, this could signal the beginning of a new uptrend. Traders watching this move look for confirmation, such as a retest of the broken level, increased volume, or bullish candlestick patterns, to justify entry.
Breakout strategies tend to be more effective in unstable environments or when a market has been confined to a narrow trading range. The view is that if the price breaks out from the band, the inactive players may enter, but this is not guaranteed.
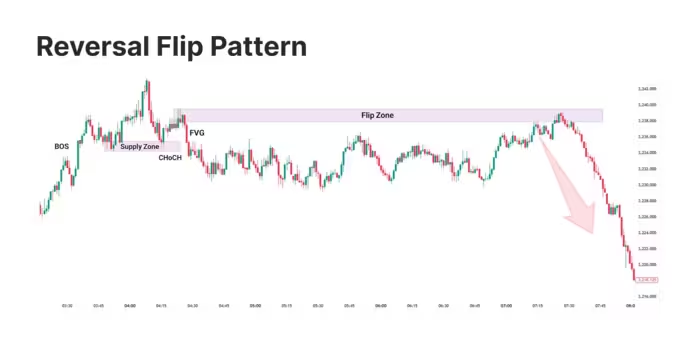
Role Reversal (Flip Zones)
One of the more nuanced aspects of support and resistance trading is the concept of role reversal, also known as “flip zones.” This occurs when a former support level transforms into a resistance level, or vice versa.
This occurs quite regularly and is a favourite technique among technical analysts. When the price breaks through support, the level tends to show up as resistance afterwards, with the original purchasing positions at support attempting to close at breakeven as the price comes back. Similarly, a breakthrough in resistance may lead to a new level of support.
These areas are the most important verification indicators in technical analysis, as they suggest that sentiment on a given level in the market may have shifted. Identifying the shifts can potentially provide the trader with a second opportunity to buy into the trend—often with increased confidence, though the results may differ.
Conclusion
Mastering support and resistance is like learning the language of the markets. These zones aren't just lines—they're reflections of the collective psychology of market participants. By recognising these price levels, you may improve your understanding of where the market might turn, pause, or break out.
So the next time you're analysing a price chart, don't just look at where the market is—ask yourself where it's likely to hesitate, bounce, or burst through. That's the power of support and resistance.
[[aa-faq]]
FAQ
What's the best time frame to draw support and resistance levels?
It depends on your trading style—day traders use shorter timeframes, while swing traders prefer daily or weekly charts.
Can support and resistance levels change over time?
Yes. As prices fluctuate, old levels may become less relevant, and new ones may emerge based on recent price action.
Is it possible for support and resistance to overlap?
Absolutely. A support level broken by a price drop may later act as a resistance level, forming a “flip zone”.
Are moving averages reliable for identifying support?
Moving Averages, especially longer-term ones like the 200-day, are often used as dynamic support or resistance levels, but like all technical indicators, they should be used alongside other analysis tools and do not guarantee market behavior.
[[/a]]
Connect with Our Experts
Our team is equipped to provide solutions precisely to your requirements. Let's explore your options and discuss how we can support your objectives


.svg)