Oops! Something went wrong while submitting the form.
Notice: It looks like you are visiting us from United Arab Emirates or have selected it as your residency location.
For accurate information and services under the correct licensed entity, please visit the appropriate section of our website. For more information view Regulatory Information
For accurate information and services under the correct licensed entity, please visit the appropriate section of our website. For more information view Regulatory Information
For educational purposes only, not investment advice.
A doji is a candlestick whose open and close land at nearly the same price, so the body shrinks to little more than a line. Long wicks above and below it show how far price traveled before it came back to the open.
The same candle carries different weight depending on where it prints. At a price level the market has already reacted to, it shows hesitation exactly where resting orders sit. In the middle of a quiet range, the same pause has nothing behind it.
This article covers the five doji types and how location changes what each one is worth.
[[aa-key-takeaways]]
Key Takeaways
A doji carries far more analytical weight when it forms at a mapped liquidity zone or order block than when it appears mid-range.
Body size separates a doji from a spinning top, since long wicks on either side belong to both.
All five doji types share a near-equal open and close. They differ in wick placement and in the rejection that placement implies.
A doji becomes more informative once market structure, such as a break of structure (BOS) or change of character (CHoCH), appears to confirm it.
A doji is one observation among several. The level it formed at and the candles after it decide what it is worth.
[[/a]]
[[aa-cta]]
Watch Doji Formations on Live Charts
B2PRIME's TradingView integration charts several timeframes at once, so candlestick structure can be watched as it forms.
A doji candlestick pattern occurs when an asset's open and close land close enough together that the real body all but disappears. The upper and lower shadows can still stretch some distance in either direction. On candlestick charts it can resemble a cross, an inverted cross, or a plus sign, depending on where the wicks sit relative to the small body.
On its own, the shape says only that market sentiment stalled, with neither buyers nor sellers ahead by the close of that timeframe.
Which side wins next depends on where the candle formed and what the candles around it are doing. B2PRIME's guide to price action trading shows where candle shapes sit in a full chart read.
Doji vs Spinning Top: Spotting the Difference
In technical analysis, a doji and a spinning top are the two shapes most often confused, since long wicks and a reading of indecision belong to both. Body size separates them. A doji's open and close sit close enough together that the real body is negligible, often just a thin line.
A spinning top has a visibly larger real body, still small next to the wicks. Price moved further from the open than a doji allows and settled there. The stalemate it shows is partial, while a doji sits closer to a full standoff between buyers and sellers.
The Five Doji Types Explained
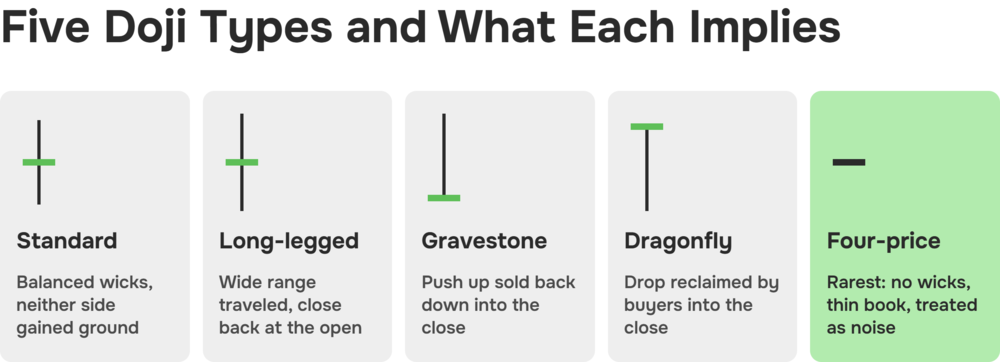
All five doji variants share the same core trait, a near-equal open and close, but differ in where the wicks sit and what kind of rejection that placement implies.
Each shape reads against nearby liquidity and order flow rather than against technical indicators. RSI marks overbought or oversold momentum and moving averages smooth direction, but neither describes the level the candle formed at.
Standard Doji
A standard doji has roughly balanced upper and lower wicks around a negligible body, showing that neither buyers nor sellers gained meaningful ground during that session. Mid-chart, away from any mapped level, it carries limited weight. The same balance at a level a trader has already flagged means the pause landed exactly where orders rest.
Long-Legged Doji
A long-legged doji stretches unusually long wicks on both sides of a tiny body, implying that price traveled a wide range within the session before closing back near where it opened. The more useful question is whether those long wicks swept resting liquidity (stop clusters above a recent high or below a recent low) before snapping back. A long wick that sweeps a level and then reclaims it says more than one that only records a choppy session.
Gravestone Doji
A gravestone doji shows a long upper wick with little or no lower wick, and an open and close that sit near the low of the candle. Buyers pushed price up during the session, only for sellers to drag it back down by the close.
A bearish order block is the last down-close candle before a strong move lower. The same doji forming where price tags one of those, or a supply zone, reads as a rejection at a level that has already shown selling interest.
Dragonfly Doji
A dragonfly doji is the mirror image: a long lower wick, little or no upper wick, and an open and close near the candle's high. Sellers pushed price down during the session and buyers reclaimed it by the close. Traders working with a liquidity framework ask where the dragonfly formed before they check it against a Fibonacci retracement level.
A dragonfly inside a demand zone or a bullish order block, the up-close mirror of the bearish case, sits where buying interest has already shown itself. Traders may read that as a possible bullish reversal.
Four-Price Doji
A four-price doji is the rarest variant: the open, high, low, and close are essentially identical, drawing a flat line where a cross would normally sit. It reflects a thin order book, as in an off-hours session on a small-cap or a thinly traded cryptocurrency where few trades crossed. It signals nothing about direction.
Most traders treat it as noise until volatility and volume come back.
Why Doji Location Changes Meaning
A doji's significance comes from where it forms as much as from its shape. Two candles with an identical shape can mean very different things. One forms exactly where a large amount of resting liquidity sits, the other drifts through open space with no level near it.
Doji at a Liquidity Zone or Order Block
In smart-money terms, an order block is generally described as the last opposing candle before a strong directional move: a down-close candle ahead of a sharp rally, an up-close one ahead of a sharp decline. A liquidity zone is an area where stop-loss orders and pending orders are likely to be clustered, often just beyond a recent swing high or low.
Hesitation that appears where resting orders and prior institutional footprints already sit is worth more attention than the same candle in open space. An order block or liquidity zone marks where price has reacted before. That history is no guarantee of a market reversal.
B2PRIME's guide to liquidity sweep trading covers how these zones tend to get tested before any follow-through.
Doji in No-Man's-Land
A doji can also form with no liquidity pool, order block, or support and resistance levels anywhere nearby. Many structure-focused traders call that stretch of chart "no-man's-land." The pause may be real, but with no level underneath it there is nothing for price to react to. Traders who treat every doji as equally meaningful, wherever it sits on the chart, generate more false signals than those who filter for location first.
Confirming a Doji With Market Structure
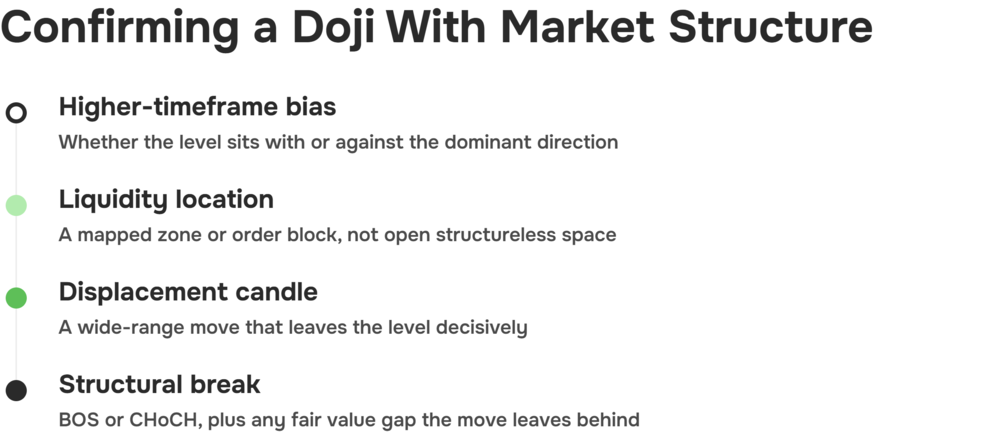
A doji is an observation, not a signal. A structure-first approach layers several pieces of context around the candle:
Higher-timeframe bias. A look at the broader trend first shows whether the doji sits inside an uptrend, a downtrend, or a range, and whether the level works with that direction.
Liquidity location. A doji at a mapped liquidity zone or order block carries more context than one mid-range.
A displacement candle. A strong, wide-range candle right after the doji, moving decisively away from the level, can suggest the hesitation has resolved.
Break of structure (BOS) or change of character (CHoCH). A BOS reads as the existing trend continuing past a prior high or low. A CHoCH points to the trend structure itself shifting. Either adds weight to what the doji only hinted at.
Fair value gap (FVG) alignment. An imbalance left behind by a displacement move can act as a reference level the market may revisit. That level adds to the doji and the BOS/CHoCH read.
Taken together, these describe a reaction zone and the structure around it. None of them guarantees an outcome.
B2PRIME's Smart Money Concepts guide goes deeper into liquidity sweeps, order blocks, BOS/CHoCH, and fair value gaps. The multi-candle formations traders watch for trend reversals, among them the morning doji star, the evening doji star, and the harami, belong to the wider set of reversal patterns in trading.
Doji Example: Liquidity Zone vs Mid-Range
The following example uses hypothetical price levels for illustration only and does not describe or predict the behavior of any real instrument.
Say a hypothetical instrument trades up to 1.2050, a swing high traders have been watching for several sessions, with resting buy-stop orders likely clustered just above it. Price prints a doji exactly at 1.2050, wicking briefly above the level before closing back below it.
The next candle is a strong bearish displacement that closes well below the doji's low. Shortly after, the breakout below the prior swing low registers a CHoCH on the lower timeframe. That leaves four separate pieces of context: the location at a known liquidity level, the doji itself, the displacement candle, and the structural break.
Compare that with a second hypothetical doji forming at 1.1975, roughly in the middle of the recent trading range, with no swing high or low, order block, or liquidity pool anywhere nearby. The candle looks identical to the first, with the same small body and similar wick proportions, but nothing in market structure follows it over the next several candles.
This second doji sits in no-man's-land, a pause worth noting that never becomes a setup.
Trade the Context, Not the Candle
Reading a doji candlestick pattern well means asking two things: where the candle formed, and whether the market structure around it lines up. The standard, long-legged, gravestone, dragonfly, and four-price doji all share one core trait, a near-equal open and close. Location is what separates them in practice: the candle either sits at a mapped liquidity zone or order block, or it sits in open space.
A doji at a level price has reacted to before, followed by a displacement candle and a BOS or CHoCH, gives a trader considerably more to work with. The same shape with nothing underneath it gives very little.
Structure-based setups depend on execution and charting as much as on reading the candle. B2PRIME's TradingView integration averages around 7 ms execution latency, with fill speed still varying by market conditions and connectivity. The figure says nothing about whether a pattern reads correctly.
B2PRIME's UNIFIED account combines crypto spot, crypto perpetual futures, and traditional CFDs on a single cross-collateral balance, with TradingView charting alongside. Doji candles can then be read against real liquidity zones and order blocks on a live chart.
[[aa-cta]]
Spot, Perps, and CFDs in One Account
B2PRIME's UNIFIED account combines crypto spot, crypto perpetual futures, and CFDs in a single cross-collateral account with tier-1 execution.
CFDs are complex instruments and come with a high risk of losing money rapidly due to leverage. You should consider whether you understand how CFDs work and whether you can afford to take the high risk of losing your money. Crypto CFDs carry additional risks due to the high volatility of the underlying assets. Losses can exceed the amount initially deposited.
This content is for informational and educational purposes only and does not constitute investment advice or a personal recommendation. Candlestick patterns and market-structure concepts are analytical tools, and nothing here is an instruction to enter or exit a position. B2PRIME (B2B Prime Services EU Ltd) is authorized and regulated by the Cyprus Securities and Exchange Commission (CySEC), license no. 370/18; product availability, eligible collateral, and leverage depend on the client's jurisdiction and applicable terms. The worked example uses hypothetical price levels that describe no real instrument and forecast nothing. This article contains forward-looking statements that involve risks and uncertainties, since the scenarios and figures described rest on simplified assumptions rather than observed outcomes. Past performance is not indicative of future results, and execution figures and third-party data are indicative and may change; verify current details before trading.
[[/a]]
[[aa-faq]]
FAQs about the Doji Candlestick Pattern
What does a doji candlestick indicate?
A doji indicates that an asset's opening and closing prices landed close enough together that the real body is negligible, showing that buyers and sellers reached a rough standstill over that candle. It does not by itself indicate which direction price may move next.
Is a doji bullish or bearish?
A doji records indecision and nothing about direction, making it neither inherently bullish nor bearish. Whether it leans one way depends on where it forms, such as at a liquidity zone or order block. It also depends on whether the candles after it follow through with a break of structure or change of character.
Is a doji a rejection candle?
A doji can function as a form of rejection candle when its wick shows price probing beyond a level and being pushed back, particularly types like the gravestone or dragonfly doji. A wick alone is not confirmation, so the level it forms at and what price does next have to be read with it.
Does a doji matter more at an order block or liquidity zone?
Yes. A doji forming at a mapped liquidity zone or order block sits where resting orders and prior price reactions already exist. That gives it more analytical weight than an identical shape mid-range with no nearby structure. An order block or liquidity zone marks a reaction zone and no more than that.
How should traders confirm a doji after a liquidity sweep?
After a liquidity sweep, traders typically look for a displacement candle moving decisively away from the swept level, followed by a break of structure or change of character on a relevant timeframe. Many also check for a fair value gap left behind by the move. Together these add context to the doji, though none of them confirms it.
[[/a]]
Connect with Our Experts
Our team is equipped to provide solutions precisely to your requirements. Let's explore your options and discuss how we can support your objectives