Oops! Something went wrong while submitting the form.
Notice: It looks like you are visiting us from United Arab Emirates or have selected it as your residency location.
For accurate information and services under the correct licensed entity, please visit the appropriate section of our website. For more information view Regulatory Information
For accurate information and services under the correct licensed entity, please visit the appropriate section of our website. For more information view Regulatory Information
Price spikes through a trader's stop-loss. A fraction of a second later it reverses and moves exactly where price action suggested it would—without them.. If that sequence feels familiar, traders who have experienced this have already encountered a liquidity sweep, and were the exit liquidity for a larger player.
Liquidity sweep trading is the practice of identifying and analysing when institutional participants push price beyond a key level—a swing high, session low, or equal-high cluster—to trigger clustered retail stop-losses before reversing and running in the opposite direction. Once you understand the mechanics, you stop being the liquidity and start reading the setup as a structured entry signal.
This guide gives you a practical, step-by-step framework for identifying and trading sweeps across forex, metals, and crypto. Every step covers execution decisions in sequence—from mapping levels before the session to placing your stop and setting a target. This is a consistency tool, not a profit guarantee; sweeps provide directional bias when confirmed, and risk is real across every trade.
[[aa-key-takeaways]]
Key Takeaways
A liquidity sweep occurs when price breaches a key level—swing high or low—to trigger clustered stop-losses, then reverses. Understanding this mechanism may help traders avoid acting as exit liquidity and instead align with institutional flow.
Buy-side liquidity sits above swing highs where short sellers place stops; sell-side liquidity sits below swing lows where long traders place stops. Knowing which pool is targeted may suggest the likely reversal direction.
Sweeps require confirmation through rejection wicks, displacement candles, and volume behaviour before they become tradeable setups. Never enter on the breach alone.
Execution speed matters when trading sweeps. B2PRIME's low execution latency may help reduce the gap between order placement and fill during fast reversals.
[[/a]]
[[aa-cta]]
Trade Liquidity Sweeps With Precision Execution Infrastructure
B2PRIME offers ~7ms average execution latency, TradingView Platinum Partner integration, and $2.50/lot commission—designed for low-latency execution during fast-moving market conditions when the reversal happens fast.
A liquidity sweep is a deliberate price move beyond a well-defined level—a swing high, swing low, previous session extreme, or cluster of equal highs—designed to trigger the stop-loss orders resting just beyond it. Once those stops execute, they generate the order flow that large participants need to fill their positions at scale without excessive slippage. Price may then reverse.
Large participants—institutional desks, algorithmic strategies, prop trading firms—need liquidity to build meaningful position sizes. The forex market alone averaged $9.6 trillion in daily trading volume in April 2025 according to the BIS Triennial Survey. At that scale, individual institutional orders require concentrated stop clusters to fill without moving price against the institution. Retail traders provide exactly that at predictable, widely-watched levels: previous-day highs and lows, session opens, round numbers, and equal-high or equal-low formations. Wherever institutional liquidity concentrates, sweeps are most likely.
This is market mechanics, not manipulation. Large participants are executing their strategies efficiently. Understanding how that works gives you a framework for reading the market's next move.
Why liquidity sweeps matter to active traders
Most traders experience a liquidity sweep as a stop-out at the worst possible moment. Price moves against you just far enough to trigger your stop, then reverses in the direction of your original analysis. Without the stop-out, the trade would have worked.
Once traders map liquidity zones before the session opens, that frustration becomes usable data. Instead of reacting to the stop-out, traders may anticipate the sweep, wait for rejection, and use the swept level as an entry basis — aligning with the flow that follows once liquidity has been absorbed.
Traders who ignore liquidity zones enter on raw signal alone—a candle pattern, an indicator cross—without asking why price is at that level right now. Traders who map liquidity zones gain two things: directional bias and a timing filter. This edge only holds when paired with confirmation. A sweep without rejection, displacement, or broader structure context is a noise event, not a setup.
What does a liquidity sweep look like on a chart
A liquidity sweep has a specific visual signature: price breaches a swing high or swing low, prints a rejection wick, and closes back inside the prior range. The wick is the evidence of the sweep; the close back inside confirms rejection.
Common sweep locations include session highs and lows (London open, New York open, Asian range), the previous day high (PDH) and previous day low (PDL), equal highs or equal lows, and weekly or monthly swing extremes.
A wick alone is not sufficient. A large upper wick could be normal price discovery. Context separates a sweep from noise: was there a clear liquidity pool at that price? Did the price close back inside the level? What happened in the next two or three candles? If a move breaches a key level without rejection and keeps going, that is a breakout—not a sweep. If a move without clear confirmation resembles a liquidity grab, treat it with the same caution and wait for structure to confirm direction.
Buy-side vs sell-side liquidity sweeps
Sell-side liquidity (SSL) sits below swing lows. Traders who are long the market place their stop-loss orders below recent swing lows. A sweep triggers those sell stops, absorbs long positions, and provides sellers for an institutional buy.
Buy-side liquidity (BSL) sits above swing highs. Traders who are short place stops above recent swing highs. A sweep triggers buy stops, absorbs short positions, and provides buyers for an institutional sell.
An SSL sweep—price dipping below the London session low, then reclaiming it—may suggest sell-side liquidity has been absorbed and a bullish reversal may follow. A BSL sweep above the New York session high, then closing back below, may suggest bearish conditions could develop. For the full breakdown of where these pools form, see B2PRIME's guide on buy-side and sell-side liquidity.
Liquidity sweep vs liquidity run
A liquidity sweep is the breach and rejection. Price moves through a pool, triggers the resting orders, and reverses. A liquidity run is what follows—price travels toward the next liquidity pool on the opposite side of the market.
The practical distinction: sweeps give you bias; runs give you targets. After an SSL sweep and bullish reversal, the nearest BSL above becomes your initial price target. After a BSL sweep and bearish reversal, the next SSL below becomes the target.
A sweep without rejection is a breakout. The confirmation steps below filter one from the other before you commit capital.
Step-by-step liquidity sweep entry setup
The following five-step framework treats each sweep as a process to validate, not a signal to act on immediately. It applies on M15 through D1 timeframes across forex, indices, metals, and crypto. The same logic holds across asset classes because the underlying mechanism—stop-loss triggering and order absorption—is universal. These steps provide directional bias when confirmed; they are not a guarantee of outcome.
1. Map higher-timeframe liquidity levels
Start on H4 or D1 before the session opens. Mark swing highs and lows from the past 5–10 sessions, equal highs or equal lows, the PDH and PDL, and London and New York session extremes. Use clean horizontal lines only—cluttered charts produce reactive, late entries.
Identify the nearest SSL below current price and the nearest BSL above it. These become your primary sweep candidates and target zones. Mapping before the session prevents a common error: marking levels after price has already moved.
2. Confirm the sweep and rejection
A breach is not a sweep until rejection is confirmed. Require all of the following before considering an entry:
Rejection wick: A candle that pierces the level and closes back inside it
Multi-candle consolidation: Two to three candles in a tight range beyond the level, then reversing—price stalls rather than accelerating
Volume behaviour: A volume spike on the breach candle, then declining volume as price turns
Do not enter on the breach alone. If price dips below the PDL, consolidates for three candles below, then a bullish engulfing closes back above it—that is a confirmed SSL sweep. The close back above is the filter; without it, you have a potential sweep only.
3. Wait for price displacement
Displacement is a strong momentum candle in the reversal direction—often with a body approximately twice the average recent candle size—that signals directional commitment rather than a brief retest. It may help distinguish stop-raid noise from directional commitment and creates a Fair Value Gap (FVG) on the chart.
A Fair Value Gap is a three-candle pattern where the middle candle's body moves so aggressively that no overlap exists between the first candle's close and the third candle's open, leaving an area of price imbalance that price commonly revisits. For how displacement and FVGs fit into the broader ICT framework, see B2PRIME's overview of ICT trading strategies.
Skipping displacement increases the odds of entering a false reversal significantly. Waiting for displacement may help reduce the likelihood of entering on noise rather than confirmed directional movement.
4. Enter on pullback to fair-value zone
After displacement, price often retraces to partially fill the FVG before continuing in the reversal direction. This pullback is your entry point.
Long (after SSL sweep): Enter at ~50% of the bullish FVG
Short (after BSL sweep): Enter at ~50% of the bearish FVG
B2PRIME's TradingView integration lets you mark your levels and FVGs on TradingView and execute directly from the chart without switching platforms.
5. Manage risk and exit
Some traders apply position sizing of 0.5–1% of account capital per trade as a risk management approach, though individual risk parameters vary. Place stops beyond the swept level—not exactly at it—accounting for spread and slippage with a buffer of several pips or ticks. Some traders take partial exits near a 1:2 risk-to-reward ratio and trail the remainder toward the next liquidity pool.
If price breaks through the opposite liquidity zone cleanly without the expected pullback, exit and reassess. A clean break in the wrong direction means the sweep failed. Reversals off swept levels can be sharp, and B2PRIME's ~7ms average execution latency may help reduce slippage during these fast-moving moments—relevant especially on shorter timeframes where the FVG pullback may last only a few candles.
[[aa-cta]]
Execute Sweep Entries With Low-Latency Infrastructure
B2PRIME's prime-of-prime infrastructure processes orders at low latency, which may help reduce execution delays during rapid price movements.
These scenarios are for educational illustration only and do not constitute investment advice.
[[aa-cta]]
Example 1 — EURUSD bullish SSL sweep (H4) The London session low and PDL converge near 1.0800. Price dips to 1.0795, breaches both levels, consolidates for three candles, then a bullish engulfing candle closes at 1.0805. A displacement candle creates a bullish FVG between 1.0805 and 1.0815. Entry: long at 1.0810 (50% FVG). Stop: 1.0790 (below swept low). Target: 1.0860 (PDH) — approximately 1:2.5 R:R.
[[/a]]
[[aa-cta]]
Example 2 — XAUUSD bearish BSL sweep (H1) The New York session high sits at 2,325. Price spikes to 2,328, pierces the session high, then closes back below 2,325 within two candles. A displacement candle creates a bearish FVG between 2,322 and 2,325. Entry: short at 2,323 (50% FVG). Stop: 2,330 (above swept high). Target: 2,305 (next SSL) — approximately 1:2.5 R:R.
[[/a]]
Both examples follow the same five steps: level mapped before the session, sweep confirmed with rejection, displacement identified, entry on FVG retracement, stop and target set relative to the swept level.
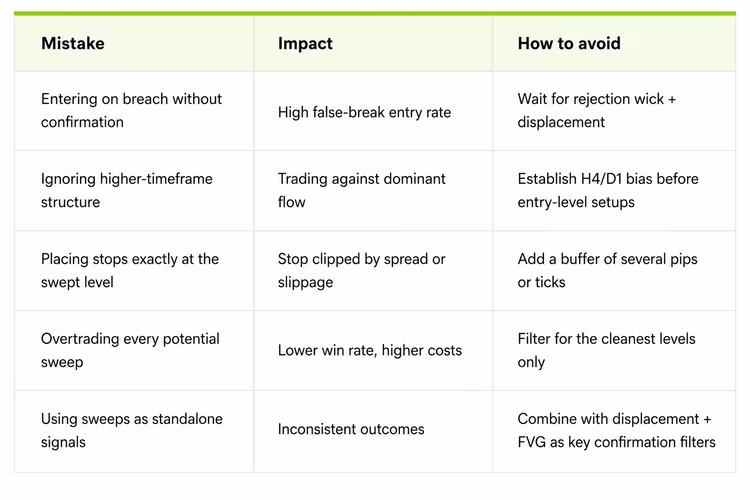
Common mistakes when trading liquidity sweeps
Track your results in a trading journal—chart screenshot at entry, rule-check for each step, outcome. Tracking results in a trading journal may provide more relevant context than generalised statistics.
Trade institutional liquidity with B2PRIME
Identifying a sweep is the analytical step. Executing cleanly is the operational one.
Sweep reversals happen fast. The FVG pullback may last three candles on M15 before price continues; orders need to fill at the intended price, not several pips away. B2PRIME's infrastructure is built for fast-moving price action—not a performance promise, but execution infrastructure where latency matters.
~7ms average execution latency — may help reduce the gap between order placement and fill during sharp reversals
TradingView Platinum Partner integration — execute directly from the same charts where you map liquidity
$2.50/lot commission — available on Raw Account (see account conditions for full fee schedule)
Multi-asset access — apply the same five-step framework across forex, gold, silver, indices, and crypto (available to eligible clients where permitted, subject to applicable jurisdiction restrictions and regulatory requirements)
Open a B2PRIME Raw Account and apply the liquidity sweep framework on live charts.
[[aa-cta]]
One Framework, Multiple Markets
B2PRIME's multi-asset prime-of-prime access lets you trade the same liquidity sweep setup across FX, metals, and crypto. Competitive pricing. Regulated. Ready.
What timeframe is best for spotting liquidity sweeps?
Sweeps appear on all timeframes, but H1–H4 provides the clearest structure for intraday trading while D1 works well for swing setups. Use higher timeframes to mark liquidity and lower timeframes—such as M15—for tighter entry execution.
Can liquidity sweep indicators replace manual analysis?
Indicators can help highlight potential liquidity zones, but they cannot reliably confirm rejection, displacement, or market context. Manual analysis is still necessary to filter valid sweeps from noise.
Do sweeps work the same in crypto and forex markets?
The mechanics are similar in both markets because stop clusters create tradeable liquidity. Crypto often shows larger wicks due to higher volatility and thinner liquidity during off-peak hours. The same five-step framework applies; adjust your confirmation criteria for the higher noise environment.
How does broker execution speed impact sweep entries?
Sweeps can reverse quickly, so delays between order placement and fill may result in worse prices or missed entries. Lower-latency execution, such as B2PRIME's ~7ms average, can help reduce slippage during fast-moving reversals.
Is trading liquidity sweeps good for beginners?
Liquidity sweeps require a solid understanding of market structure and patience to wait for confirmation before entering. They are generally better suited to traders who have already learned core price action skills. Beginners should practise in a demo environment before risking capital.
[[/a]]
Connect with Our Experts
Our team is equipped to provide solutions precisely to your requirements. Let's explore your options and discuss how we can support your objectives


.svg)