Oops! Something went wrong while submitting the form.
Notice: It looks like you are visiting us from United Arab Emirates or have selected it as your residency location.
For accurate information and services under the correct licensed entity, please visit the appropriate section of our website. For more information view Regulatory Information
For accurate information and services under the correct licensed entity, please visit the appropriate section of our website. For more information view Regulatory Information
A fair value gap (FVG) is a three-candle price pattern that signals market imbalance, creating zones where price often returns before continuing its move. If you keep hearing the term in ICT-style analysis but want concrete rules—not theory—this guide delivers exactly that.
FVGs appear on every liquid chart: EUR/USD on a 5-minute timeframe during the London open, Bitcoin perpetuals after a sharp volume spike. The mechanics are identical across both. What may differentiate traders who apply FVGs effectively from those who don't often comes down to precise identification, timed entry, and defined exits.
This guide walks through the exact anatomy of bullish and bearish FVGs, a three-step checklist for spotting valid gaps in real time, two entry styles with specific stop and target rules, and worked examples across forex and crypto markets. By the end, traders may have a structured FVG framework to explore in their next session.
[[aa-key-takeaways]]
Key Takeaways
A fair value gap forms when a large middle candle creates a price zone with no overlap between the first and third candles—this imbalance often attracts price back before the trend continues.
Bullish FVGs may suggest potential long entry areas when price retraces into the gap during uptrends; bearish FVGs may present potential short opportunities during downtrends.
Entry timing matters: wait for price to touch or partially fill the gap zone rather than anticipating the retest, reducing false signal exposure.
Stop-loss placement beyond the opposite gap boundary and targets at prior structure levels create defined risk-reward frameworks for each trade.
FVG-based approaches may be applied across forex, crypto spot, and perpetual futures—execution quality and commissions can affect the outcome of these short-term setups.
[[/a]]
What Is a Fair Value Gap?
A fair value gap is a three-candle formation where aggressive buying or selling creates a price zone the market skipped over. When a displacement candle moves price so forcefully that the wicks of the surrounding candles don't overlap, the space between those wicks becomes the FVG. It marks where supply and demand were so imbalanced that price moved too fast to fill orders at every level.
FVGs are not overnight gaps or common session-break discontinuities. A regular daily-chart gap occurs because no trading happened between sessions. An FVG is an intraday inefficiency—the market was actively trading but moved through a zone without establishing two-way participation. That distinction makes the pattern tradeable: price skipped levels, not the clock.
The ICT methodology, developed by Michael Huddleston, brought FVGs into mainstream technical analysis as one of several smart-money concepts alongside order blocks and liquidity sweeps. The core premise: large participants often need to revisit zones where they couldn't complete their initial order during the displacement—creating the conditions for a structured retest entry.
Three conditions define a valid FVG:
A clear middle candle with an exceptionally large body
No overlap between Candle 1's wick and Candle 3's opposite wick
The pattern forms in a trending, liquid market—not inside a consolidation range
All three must be present. Without them, what looks like an FVG is price noise.
Bullish vs. Bearish FVG Anatomy
Knowing the exact boundaries of each FVG type is the starting point for every trade setup.
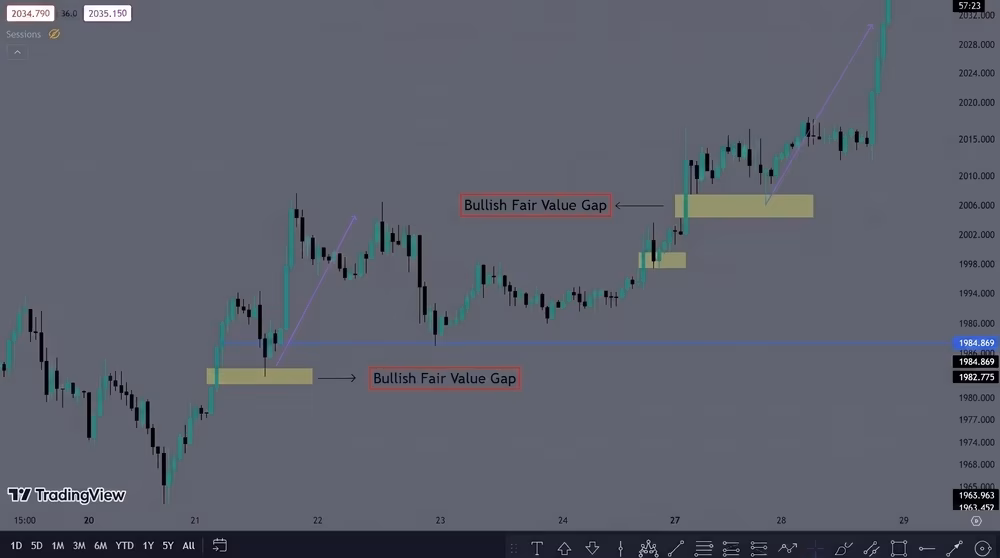
Bullish FVG:
Candle 1: Preceding candle (reference)
Candle 2: Large bullish body — the displacement candle
Candle 3: Following candle
Non-overlap condition: High(C1) < Low(C3)
Gap bottom = High(C1); Gap top = Low(C3)
Invalidation: A close below the bottom boundary (High of C1)
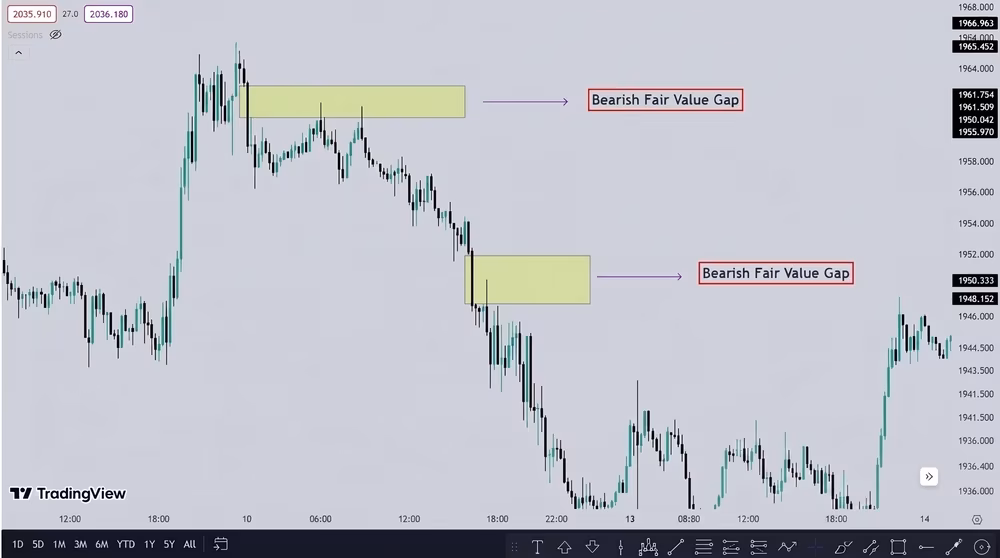
Bearish FVG:
Candle 1: Preceding candle
Candle 2: Large bearish body — the displacement candle
Candle 3: Following candle
Non-overlap condition: Low(C1) > High(C3)
Gap top = Low(C1); Gap bottom = High(C3)
Invalidation: A close above the top boundary (Low of C1)
One point traders consistently get wrong: wicks count. Use the full high and low of each candle—not the open or close. Checking body-to-body overlap is a common error that produces false FVGs in fast-moving markets.
Invalidation rules matter as much as identification. A bullish FVG that gets closed through becomes a broken level. Remove it from your chart rather than watching for a bounce that the structure no longer supports.
How to Spot an FVG Fast
This is a rapid, repeatable scan—three steps you can run in seconds on any chart.
1. Confirm the three-candle gap
Start with the large middle candle. It anchors the pattern, so identify the most obvious displacement bar on your chart first. Then check Candle 1 (one bar back) and Candle 3 (one bar forward). Apply the non-overlap test:
[[aa-cta]]
High(C1) < Low(C3) for bullish, or Low(C1) > High(C3) for bearish.
[[/a]]
If either wick crosses at all, there's no FVG. Wicks are part of the test—use the full high and low, not just the candle body.
2. Mark the gap boundaries
Draw a rectangle from the bottom boundary to the top boundary of the FVG and extend it to the right. This box tracks the zone until price interacts with it. Green for bullish FVGs, red for bearish—color-coding lets you scan a chart in seconds.
Both TradingView and cTrader support rectangle drawing tools with right-hand extension. The box stays on your chart until price fills the gap or you remove it, giving you a persistent map of open imbalances across your watchlist.
3. Validate context and volume
Not every FVG is worth trading. Two quick filters keep you focused on quality:
Two filters is enough. Adding more conditions—RSI overlays, time-of-day rules, spread thresholds—reduces valid setups to near zero without meaningfully improving quality.
Why Price Revisits the Gap
Price may return to FVG zones based on how markets function at a structural level.
Auction market theory frames all financial markets as continuous two-way auctions. Price moves up to find sellers and down to find buyers. When a displacement candle skips multiple price levels, it signals that one side briefly overwhelmed the other—but the auction is never fully settled at those skipped prices. The market may revisit those levels to test whether participants are willing to transact there.
For large participants, the logic is more practical. An institution building a long position during an upside displacement may not have filled its entire order during the initial move. To complete the position at favorable prices, it may let price retrace into the gap zone. That participation reinforces the FVG as a structural level and can create the next leg higher.
The takeaway: FVGs are probabilistic, not guaranteed. High-volume, trend-aligned gaps in liquid sessions may fill more consistently than counter-trend gaps formed during low-activity windows. The "why" helps you prioritize which boxes to trade and which to ignore.
Entry and Exit Rules for FVG Trading
Three frameworks cover the full range of FVG-based setups, from patient to aggressive.
1. Basic retest entry
Setup: Price retraces back into the FVG after the initial displacement move.
Trigger: Enter at or near the 50% midpoint of the gap, or on a confirmation candle—a pin bar rejection or bullish/bearish engulfing—that forms inside the zone.
Why this works: The midpoint is a level where price has historically shown a notable tendency to react, according to some analyses. Entering here gives you a tighter stop and cleaner risk-reward than entering at the outer boundary.
Some traders consider this a higher-probability approach among FVG entry styles. It requires patience and confirmation rather than early entry, which is why it suits traders building familiarity with the pattern.
2. Breakout continuation entry
Setup: Price enters the FVG partially (under 50% fill) and then breaks structure in the original displacement direction without a full retracement.
Trigger: A momentum candle closing beyond the relevant structural level—prior swing high in a bullish setup, prior swing low in a bearish one.
Trade-off: Lower win rate than the retest entry, but typically higher reward per winner. This entry style may be more relevant in strong trending conditions where momentum appears directional and the partial gap fill suggests institutional continuation rather than distribution.
3. Stop-loss and target framework
Stop-loss: Place the stop just beyond the opposite boundary of the FVG—below High(C1) for bullish setups, above Low(C1) for bearish ones. Add 5–10 pips of buffer depending on asset volatility to avoid stop hunts at the exact boundary.
Target options:
Next structural level: prior swing high (bullish) or prior swing low (bearish)
Fixed risk-reward: 1:2 minimum baseline; extend to 1:3 in strong trend conditions
Partial exits: take half the position off at 1:1.5R, move stop to break-even, hold the remainder to structure
Position sizing: Risk no more than 0.5–1% of account equity per trade. With a $10,000 account, that caps your dollar risk at $50–$100 per trade. Size from there—not from a round lot number.
[[aa-cta]]
Ready to Execute These Setups?
B2PRIME's Raw Account offers direct market access with 7ms average execution—built for active, precision-driven strategies.
The same three-candle rules apply in forex, crypto spot, and perpetual futures. The assets differ; the pattern logic doesn't.
EUR/USD intraday setup
Scenario: A bullish FVG forms on a 5-minute EUR/USD chart during the London session. The displacement candle breaks above a key intraday resistance level with above-average volume.
Levels:
Gap zone: 1.0850–1.0865
Price retraces to 1.0858 (mid-gap)
Entry: long at 1.0858
Stop: 1.0845 (5 pips below gap bottom)
Target: 1.0890 (prior swing high)
Outcome: +32 pips at approximately 1:2.5 risk-reward
This is a simulated example for educational purposes—past patterns do not guarantee future results.
The London–New York overlap session (13:00–16:00 UTC) may deliver tighter EUR/USD spreads and higher intraday volume, making it a commonly referenced window for FVG setups on this pair.
Bitcoin perpetual futures setup
Scenario: A bullish FVG forms on a 3-minute BTC/USD perpetual futures chart following a significant volume spike.
Levels:
Gap zone: $68,200–$68,450
Price touches the gap bottom and forms a pin bar rejection
Entry: long at $68,500 after breakout confirmation
Stop: $68,100 (below gap zone)
Target: $69,500
Risk per contract: $400; Reward per contract: $1,000 (1:2.5R)
In crypto perpetuals, price moves faster than in forex. Use limit orders when entering at gap boundaries where practical. Check funding rates before holding positions overnight—a high positive funding rate on a long increases your cost of carry.
Crypto Perpetual Futures with leverage up to 1:155 may be used by traders when assessing these short-term setups—though leverage amplifies both potential gains and potential losses.
[[aa-cta]]
Crypto Perpetual Futures are available to eligible clients under the Bahamian DARE regime, where permitted, subject to jurisdiction restrictions.
[[/a]]
[[aa-cta]]
Trade BTC and FX From One Account
B2PRIME's cross-collateral account covers Crypto Spot, Perpetual Futures, and traditional CFDs—one balance, full flexibility.
Manually scanning multiple charts for FVG formations across a 10–20 instrument watchlist takes time. Automation removes the repetitive identification work without eliminating the judgment calls.
TradingView's public indicator library includes community-built FVG scanners that automatically draw boundary rectangles as gaps form. Search "FVG" or "Fair Value Gap" in the TradingView public library to find well-tested scripts that color-code zones by direction.
B2PRIME's TradingView Platinum Partner integration connects scanning directly to execution: you can set price alerts at gap boundaries and place trades without switching platforms. For traders running multiple FVG setups across forex and crypto simultaneously, removing platform-switching friction reduces missed entries and execution errors.
For cTrader users, B2PRIME supports full cAlgo algorithmic access, enabling custom FVG detection scripts and alerting logic within the cTrader environment.
Managing Risk on Leveraged FVG Trades
FVG setups use tight stops—that precision is part of their edge. But tight stops combined with leverage mean that position sizing is non-negotiable on every trade.
Core rule: Risk no more than 0.5–1% of account equity per trade. Define that risk in dollar terms before calculating position size. Never start with a round lot and work backward.
How leverage changes the math: A 10-pip stop on EUR/USD at 1:10 leverage represents a different dollar risk than the same stop at 1:100. Higher leverage doesn't give you bigger positions—it gives you finer control over position sizing. Misuse it and you concentrate risk; apply it correctly and it lets you run multiple setups efficiently without overexposure.
Common stop-loss mistakes on FVG trades:
Moving the stop inside the gap boundary "to give it more room"—this invalidates the setup logic and exposes you to a legitimate pattern failure that your original stop placement would have handled correctly
Using fixed pip stops without adjusting for session volatility—FVGs that form during news events carry wider candles, so add a buffer proportional to the recent ATR
Execution cost matters at volume: Active FVG traders typically run 10–20 setups per week. B2PRIME's commission of $2.50/lot per side compares to commission levels seen at other providers; actual impact on outcomes will vary depending on trading frequency and strategy.
[[aa-cta]]
Leverage amplifies both potential gains and potential losses. You could lose more than your initial deposit.
[[/a]]
[[aa-cta]]
Low-Cost Execution for Active Strategies
B2PRIME's Raw Account: $2.50/lot per side, 7ms average latency, and multi-asset access across forex and crypto.
FVG strategies are execution-sensitive. Fill quality, trading costs, and platform workflow determine whether the edge in the pattern converts to realized results.
B2PRIME provides a unified, cross-collateral account covering Crypto Spot, Crypto Perpetual Futures, and traditional CFDs. One account balance funds positions across forex pairs and crypto instruments—no need to manage separate accounts or transfer margin between platforms.
For FVG trading specifically:
Execution speed: 7ms average execution latency (measured under standard conditions; actual latency may vary depending on market conditions and connectivity) reduces slippage on limit and market entries at gap boundaries
TradingView integration: Scan for FVGs with community indicators, set boundary alerts, and execute directly from charts without switching platforms
Competitive commissions: $2.50/lot per side versus $3.50 industry benchmark—$2.00 savings per round trip
Platform options: TradingView, cTrader, or B2TRADER, depending on your workflow preferences
Regulatory coverage: CySEC, DFSA, FSCA, FSC Mauritius, FSA Seychelles, and Securities Commission of The Bahamas
Yes. TradingView's public indicator library includes community-built FVG scanners that highlight gaps automatically as they form. B2PRIME's TradingView Platinum Partner integration lets you execute trades directly from the chart, so you can move from signal to execution without switching platforms.
Do FVG patterns work the same in spot crypto and futures?
Yes, the three-candle structure and identification rules are identical in spot and futures markets. Liquidity, fees, and volatility differ across the two, which can affect how cleanly price revisits and reacts to a gap. Crypto perpetuals tend to produce faster moves, making slippage control and position sizing more critical compared to spot trading.
Crypto CFDs carry additional risks due to the high volatility of the underlying assets, and retail clients should be aware that the majority of retail CFD accounts lose money.
How many unfilled FVGs can occur on one chart?
Multiple unfilled FVGs can exist simultaneously, especially after volatile moves. Prioritize gaps closest to current price that align with the higher-timeframe trend. Don't feel obligated to trade every marked zone.
Is there an FVG indicator for mobile platforms?
Yes. TradingView's mobile app (iOS and Android) supports many of the same custom indicators available on desktop, including FVG detection tools. As long as the script is compatible with the mobile version of the app, you can scan and mark gaps directly from your phone.
What timeframes work best for fair value gap trading?
Intraday timeframes between 3 and 15 minutes produce frequent, tradable setups on liquid markets. Higher timeframes generate fewer signals but with wider stop distances. Most FVG traders start on the 5-minute chart and use the 1-hour for directional context before executing.
[[/a]]
Connect with Our Experts
Our team is equipped to provide solutions precisely to your requirements. Let's explore your options and discuss how we can support your objectives


.svg)