Oops! Something went wrong while submitting the form.
Notice: It looks like you are visiting us from United Arab Emirates or have selected it as your residency location.
For accurate information and services under the correct licensed entity, please visit the appropriate section of our website. For more information view Regulatory Information
For accurate information and services under the correct licensed entity, please visit the appropriate section of our website. For more information view Regulatory Information
A breakout looks simple on a chart: price sits under a level for a while, then pushes through it. The hard part is telling a real breakout from a false one before committing to the trade. This guide covers what a breakout is, why so many fail, the core chart patterns that produce them, and a repeatable way to confirm and manage a breakout entry across forex, crypto, and indices.
The aim is a decision checklist, not a promise. A breakout marks a point where price leaves a defined range or pattern, but the level breaking is only the start; confirmation and risk control are what turn it into a plan.
[[aa-key-takeaways]]
Key Takeaways
A breakout is a move beyond a defined level of support or resistance, and it can lead to trend continuation or a reversal of the prior move.
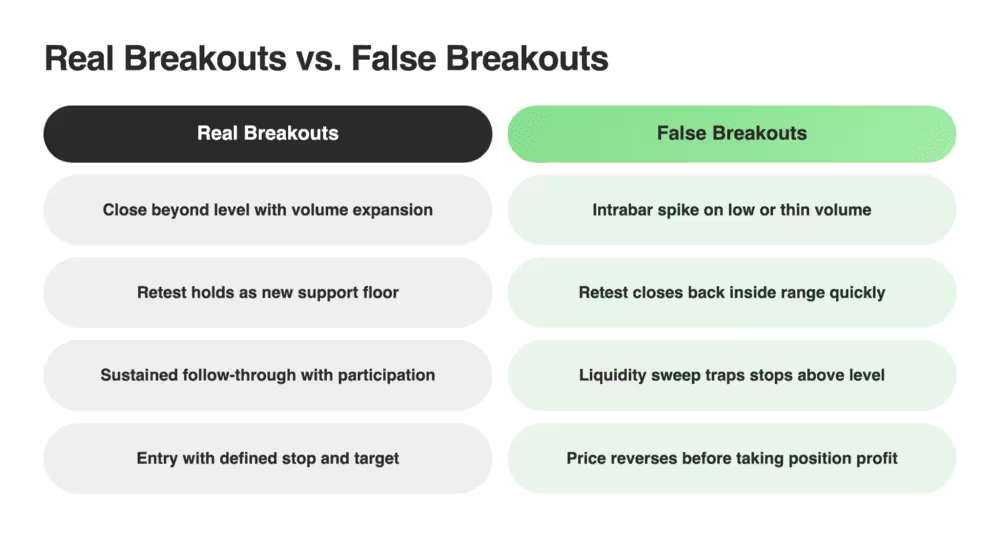
Many breakouts fail because price only swept liquidity above a level or broke out on thin volume, so confirmation matters more than the break itself.
The most common breakout structures are horizontal ranges, ascending and descending triangles, flags and pennants, and the cup and handle.
A breakout is more credible when price closes beyond the level on expanded volume and, ideally, holds a retest of the broken level.
Position sizing and a predefined stop are essential, because any breakout can fail regardless of how clean the pattern looks; leveraged trading can amplify both gains and losses.
[[/a]]
What Is a Breakout in Trading?
A breakout occurs when price moves beyond a level that has been holding it, such as a resistance ceiling or a support floor. Imagine a currency pair that has traded between 1.2000 and 1.2500 for several weeks. Each time it reaches 1.2500 it turns back down, so that level acts as resistance. A daily close above 1.2500 would be a breakout above that range.
Breakouts come in two forms. A continuation breakout pushes further in the direction of the existing trend, for example price breaking to new highs within an uptrend. A reversal breakout moves against the prior direction, such as price breaking below the support of a long uptrend. The pattern and the surrounding trend give the context for which is more likely.
One useful detail is the resistance-to-support flip. When price breaks above a resistance level and then pulls back, that former ceiling can act as a new floor. The reverse holds for a broken support level, which can become resistance on a bounce. This flip is the basis for the retest entries covered later.
Why Some Breakouts Fail
Before choosing a pattern, it helps to understand how breakouts fail, because the failure modes shape the confirmation rules. A false breakout is a move beyond a level that does not hold, trapping traders who entered on the initial break. Our guide to false breakouts in trading covers this in more depth.
Liquidity Sweeps Above Resistance
Obvious levels attract stop orders. Buy stops cluster above resistance, and a brief push through the level can trigger them before price reverses back into the range. This is a liquidity sweep: the move exists to reach resting orders, not to sustain a trend. Our explainer on how to identify and avoid a liquidity grab describes the pattern, and it is a common reason a breakout entry gets stopped out almost immediately.
Low-Volume Breakout Attempts
A breakout on thin volume suggests limited participation behind the move. Without enough orders to sustain the push, price often drifts back inside the range. News-driven spikes create a related trap: a headline can whip price through a level and then reverse just as quickly once the initial reaction fades. In both cases, the break lacks the follow-through that a durable move usually shows.
[[aa-cta]]
One Account for Every Breakout Setup
Trade forex, indices, commodities, and crypto from a single cross-collateral account, and use spot crypto as margin for CFD positions.
Most breakouts form from a handful of recurring structures. Recognising them helps a trader mark the level to watch in advance. For a wider catalogue, see our overview o trading patterns every trader should know.
Horizontal Range
A horizontal range is price moving sideways between a flat support and a flat resistance. The breakout level is simply the top or bottom of the range. Ranges are among the clearest structures because the level is obvious, though that same obviousness is why they attract liquidity sweeps.
Ascending or Descending Triangle
An ascending triangle has a flat resistance level and a rising support line, which reflects buyers stepping in at higher prices while sellers defend one ceiling. A descending triangle mirrors this with flat support and a falling resistance line. The breakout is generally watched in the direction of the flat side, but the move still requires confirmation.
Flag or Pennant
Flags and pennants are short consolidations that form after a strong move. A flag is a small channel that slopes against the prior move; a pennant is a small triangle. Both represent a pause before price may continue in the original direction. Because they follow an established move, they are often read as continuation structures.
Cup and Handle
A cup and handle is a rounded base (the cup) followed by a small pullback (the handle). The breakout level is the rim of the cup. It is a longer structure that can take weeks to form, and the handle offers a defined area to watch for the entry.
Confirming a Real Breakout
Confirmation is the filter that separates a tradeable breakout from a trap. No single signal is decisive, but two checks materially raise the quality of a setup.
Close Beyond the Level & Volume Expansion
An intrabar spike through a level is weaker than a candle that closes beyond it, because a close reflects acceptance rather than a momentary wick. Traders may consider requiring a close beyond the level, and some use a two-close rule, waiting for two consecutive closes to filter marginal breaks.
Volume adds context: a breakout accompanied by volume expansion, often cited around 1.5 to 2 times the recent average, suggests broader participation than a quiet drift through the level. Volume behaves differently across markets, so it is read as supporting context rather than a precise threshold. Understanding support and resistance helps identify which level deserves this scrutiny.
Retest That Holds
After a breakout, price often returns to test the broken level. If the former resistance now holds as support, that retest can offer both confirmation and a defined entry with a nearby invalidation point. A retest that fails, with price closing back inside the range, is a warning that the break may have been false. Waiting for a retest can mean missing the fastest moves, but it filters many low-quality entries.
Stops and Targets for Breakout Strategies
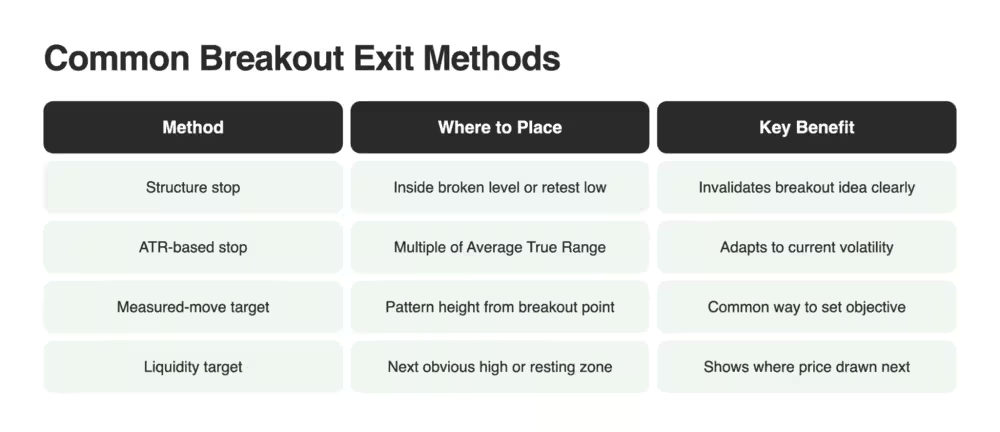
A breakout plan needs an exit plan before entry. Several approaches are common, and they can be combined:
Whichever method is used, position size should be set so the loss at the stop stays within a predefined, consistent percentage of capital. This matters more than the entry itself, because breakouts fail regularly and a single oversized loss can undo many good trades. Leveraged trading can amplify both gains and losses, so risk per trade should be defined before entering.
Cross-Asset Examples Using B2PRIME's Unified Account
The same breakout logic applies across markets, with each asset's own character. A few illustrative scenarios:
EUR/USD range. A pair consolidating in a tight range may offer a horizontal-range breakout, confirmed by a daily close beyond the level and a retest that holds.
Bitcoin triangle. Crypto often forms clean triangles, though higher volatility means wider stops and more frequent liquidity sweeps, so confirmation is especially useful.
US500 index. An index flag after a strong move may offer a continuation breakout, where volume expansion on the break adds context.
These are illustrative, not recommendations, and each still requires the confirmation and risk steps above. Because breakouts often resolve quickly, execution quality matters to the process, and B2PRIME's neutral tier-1 execution targets low latency, though fill speed varies with market conditions and connectivity.
B2PRIME's unified cross-collateral account holds Crypto Spot, Crypto Perpetual Futures, and traditional CFDs (forex, metals, indices, commodities) in one balance, so the same breakout workflow can be observed across all of them without moving funds between platforms.
Start Trading Breakouts on a Transparent, Low-Cost Broker
Breakout trading rewards a repeatable process and a stable environment to run it in. B2PRIME is a multi-regulated broker with neutral tier-1 execution, no internalisation, and transparent published conditions, with charting through TradingView (as an official Platinum Partner), cTrader, and B2TRADER. The RAW account offers commission-based pricing from $2.50 per lot per side with no minimum deposit, below the roughly $3.50 per lot common to RAW accounts elsewhere; lower transaction costs reduce the break-even threshold on a strategy but do not, on their own, make it profitable. Leveraged trading can amplify both gains and losses.
[[aa-cta]]
Keep More of Every Breakout Trade
RAW pricing from $2.50 per lot per side, zero minimum deposit, and automated near-instant withdrawals, with every condition published in full.
CFDs are complex instruments and come with a high risk of losing money rapidly due to leverage. You should consider whether you understand how CFDs work and whether you can afford to take the high risk of losing your money. Crypto CFDs carry additional risks due to the high volatility of the underlying assets.
This content is for informational and educational purposes only and does not constitute investment advice or a personal recommendation. B2PRIME (B2B Prime Services EU Ltd) is authorised and regulated by the Cyprus Securities and Exchange Commission (CySEC), licence no. 370/18.
[[/a]]
[[aa-faq]]
FAQs about Breakout Patterns
Do I need indicators to trade breakouts?
No. Breakout trading is based on price levels, chart structure, and volume rather than lagging indicators. Some traders add a single tool, such as a volume measure or an ATR reading for stops, but the core method relies on reading the level and the confirmation around it.
How do I avoid false breakouts?
You cannot avoid them entirely, but confirmation filters many. Waiting for a candle to close beyond the level, looking for volume expansion, and allowing a retest to hold all reduce the chance of entering a move that reverses. Defining an invalidation level before entry limits the cost when a break does fail.
Do breakout patterns work on crypto?
Yes. Breakout structures appear on crypto CFDs as they do on forex and indices, because they reflect general market behaviour around levels. Crypto tends to be more volatile, which can mean wider stops and more frequent liquidity sweeps, so confirmation is particularly useful.
What timeframe is best for trading breakouts?
There is no single best timeframe; it depends on the trader's style. Higher timeframes such as the daily produce fewer but often cleaner breakouts, while lower timeframes offer more setups with more noise. Many traders read the level on a higher timeframe and refine entries on a lower one.
How do I choose which breakout pattern to trade?
Trade the pattern that is clearest on the chart in front of you rather than forcing a setup. A well-defined horizontal range or triangle with an obvious level is usually easier to manage than an ambiguous structure. If no clean pattern is present, standing aside is a valid choice.
Where should I place my stop on a breakout trade?
Common placements are just inside the broken level, below the retest low, or a multiple of ATR from entry. Whichever is used, the position should be sized so the loss at that stop stays within a consistent percentage of capital, since breakouts fail regularly.
[[/a]]
Connect with Our Experts
Our team is equipped to provide solutions precisely to your requirements. Let's explore your options and discuss how we can support your objectives



.svg)


.avif)