Oops! Something went wrong while submitting the form.
Notice: It looks like you are visiting us from United Arab Emirates or have selected it as your residency location.
For accurate information and services under the correct licensed entity, please visit the appropriate section of our website. For more information view Regulatory Information
For accurate information and services under the correct licensed entity, please visit the appropriate section of our website. For more information view Regulatory Information
For educational purposes only, not investment advice.
Slippage is the difference between the price a trader sees when sending an order and the price that order fills at. A buy on EUR/USD placed at 1.20000 can come back filled at 1.20003, or 0.3 pips of slippage, a few dollars on a standard lot.
One fill like that is noise. The same difference landing on the same side across dozens of fills is a pattern, part of it from the market and part from how a broker routes and confirms the order.
This article covers what happens between the click and the fill, and how to tell market movement from execution in a trade history.
[[aa-key-takeaways]]
Key Takeaways
Slippage is the gap between the expected price and the executed price, working in a trader's favor (positive) or against them (negative).
Requested-vs-filled trade history tells whether slippage is coming from market conditions or from execution quality.
Manual dealing desk intervention, external liquidity routing, and last-look practices can all introduce execution-side slippage beyond ordinary market movement.
Slippage shows up differently across forex, CFDs, stocks, futures, and commodities, mostly depending on liquidity and volatility at the time of the trade.
Slippage alone does not prove anything is wrong, though a persistent, one-sided pattern is a reasonable trigger to audit how a broker executes.
[[/a]]
[[aa-cta]]
See execution costs upfront
Compare spreads, commissions, and execution model side by side before committing real size to a trade.
Slippage is the difference between the price aimed for and the execution price that comes back. The fill that comes back sits a touch higher, a touch lower, or exactly where it was expected. None of those three outcomes is unusual.
Markets update continuously, even in calm sessions. A quote holds for the millisecond its feed was read, after which the market has often taken another step before the order arrives. The difference shows up inside that window.
Three trading costs get confused with slippage. Bid-ask spreads measure the gap between the highest bid and the lowest offer, commission is a flat fee, and swap is the overnight financing charge. None of those describe a fill landing at a different level than requested, leaving slippage a separate cost across FX, CFDs, futures, stocks, and liquid crypto pairs.
How a Trade Order Actually Gets Filled
The sequence behind every fill is straightforward once laid out:
A platform quotes whatever price its feed shows as best at that exact millisecond.
An order is submitted.
While the order travels, the order book shifts. Liquidity appears, disappears, or gets reordered.
The broker executes at whatever level the venue can fill once the order arrives.
Slippage comes from that gap, sized by execution speed, liquidity depth, volatility, and network routing. FX measures it in pips, futures in ticks, equities in cents, all the same gap in different units.
A buy order on EUR/USD at 1.20000 returns a fill at 1.20003, or 0.3 pips of slippage. Barely noticeable on one trade, the same 0.3 pips accumulates across dozens or hundreds.
Slippage Examples Across Asset Classes
Liquidity depth and trading hours differ enough between markets that price slippage looks different in each one. High volatility around news events, low liquidity in the book, and market gaps at session opens are the market-driven causes behind most of what follows, staying consistent even when the numbers differ asset to asset.
Sudden, one-sided order flow compounds that. When stop-loss orders cluster at similar levels during a thin session, the market can move sharply before an order reaches the venue. See how to identify and avoid a liquidity grab in forex for how thin books and clustered stops interact.
Forex and CFD Slippage Examples
FX is usually the cleanest market for fills, with deep and continuous liquidity in major forex pairs such as EUR/USD and GBP/USD. During economic data releases, though, the book can move faster than any single price can hold.
On a typical high-impact data morning, EUR/USD quoted at 1.10000 might return a fill at 1.10006 on a buy order, 0.6 pips of slippage driven by widening spreads and market makers pulling size for a moment.
CFDs behave similarly. Majors trade smoothly, less-liquid crosses thin out quickly, and leverage turns even a small price drift into a more meaningful cost.
Stocks, Futures, and Commodities Examples
Equities keep a different rhythm, their liquidity thinning around earnings reports and the closing auction. A mid-cap stock might quote at $50.00, fill part of an order there, and print the rest at $50.12 where the next liquidity sits. Large-cap stocks during main hours tend to be stable, while thinly traded names, small ETFs, and off-session trading fill less predictably.
Futures can be unforgiving around opens, closes, and contract-roll periods, when books are busy but temporarily unstable. Commodities without heavy speculative flow show the same pattern in illiquid markets, where one order can shift the book several ticks. Crypto pairs are no different: less-liquid tokens or volatile stretches may produce larger-than-usual slippage, for broadly the same reasons.
Putting a number on any of these examples uses the same formula:
On a single trade the result is often just a few dollars. Institutions track the cumulative version under the name "implementation shortfall," which measures how far filled positions ended up from the planned entry level across many trades, whether the order was worked by hand or scheduled against a time-weighted average price.
Whether the result is noise or a cost worth investigating comes down to frequency and consistency, at five lots a month as at five hundred.
[[aa-cta]]
RAW Pricing, Per Lot Per Side
RAW pricing starts at $2.50 per lot per side, with no last-look execution on any of the three platforms.
The answer sits in a personal trade history. Do the fills look like ordinary market movement, or like something more consistent than that?
Compare Requested vs. Filled Prices
Log, trade by trade, the price requested against the price received, in pips or basis points. Apply the cost formula above to each one so the dollar impact appears alongside the price gap. Dozens of fills side by side make a pattern visible where a handful of them settles nothing.
Segment Results by Session and Order Type
Group the log three ways: market orders vs. limit orders, high-volatility news sessions vs. quiet ones, frequently traded instruments vs. occasional ones. Slippage spread evenly across those groups, mostly clustering in known volatility windows, looks like ordinary market behavior. Slippage clustering in calm conditions, on one order type, or consistently in one direction regardless of conditions, points toward execution instead of the market itself.
Execution-Side Causes of Slippage
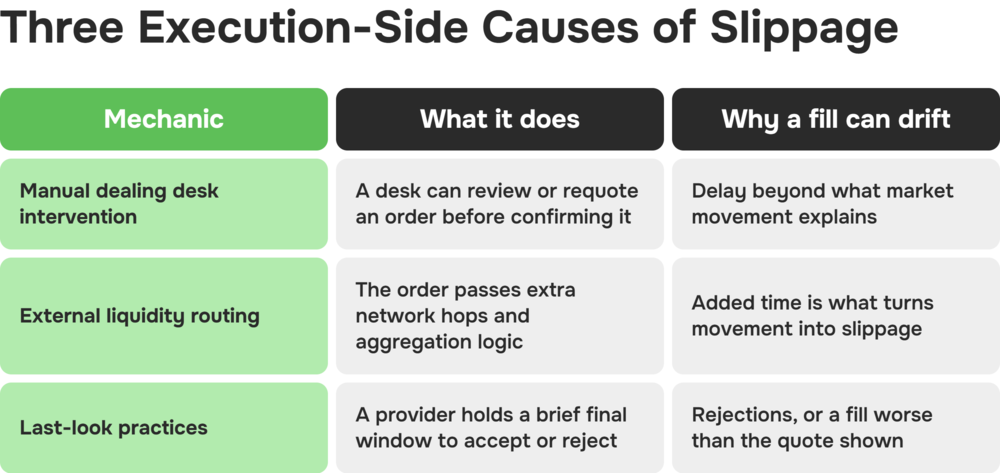
Market conditions explain a lot of slippage, but not all of it. The mechanics a broker uses to process an order can also shape where a fill lands. Occasional slippage in both directions is normal everywhere. A pattern that stays one-sided across many fills earns a closer look at three mechanics in particular.
Manual Dealing Desk Intervention
Some execution models route orders through a dealing desk that can review or intervene on a trade before confirmation, adding delay or a requote beyond what market movement alone would explain. This differs from direct market access (DMA) or straight-through processing, where orders pass to liquidity venues without manual review.
Which model a broker uses is worth establishing first, a distinction ECN vs. STP brokers sets out. Using a dealing desk is a business model, not evidence of misconduct.
External Liquidity Routing
When an order routes to external liquidity providers rather than matching internally, it typically passes through additional network hops and aggregation logic before filling. Each hop adds a small amount of time, down in the fractions where high-frequency trading firms compete. Market movement during those added milliseconds arrives as slippage.
For background on how multiple liquidity sources combine into one tradable price, see what is liquidity aggregation and how it works. Routing quality and the liquidity bridge connecting a broker to its sources decide how much of that latency a trader actually feels. Automated strategies that run from a VPS close to the venue are buying part of it back.
Last-Look Practices
Last look, formally addressed in **Principle 17 of the FX Global Code**, is a practice where a liquidity provider gets a brief final window to accept or reject a trade request against its quoted price before confirming it. The Global Code stops short of prohibiting last look and asks for transparency about its use and disclosure of how the window works. Regulators and industry bodies have kept the practice under review since.
The point is not that any provider misuses it. A last-look window can sit behind a rejected or worse-than-expected fill, separately from anything the market did. Recurring negative slippage is worth reading with that window in mind.
Reducing Slippage: Tolerance and Order Tactics
Slippage cannot be eliminated in any market. A trader can still influence how often it hits, how hard, and whether a broker's execution model works with them or adds friction on top of the market's own noise.
Order type is one of the more direct controls a trader has. Market orders prioritize getting filled over price, while limit and stop-limit orders cap the price accepted at the cost of certainty that the order fills at all. Slippage tolerance settings, which crypto venues have long offered and other platforms increasingly support, reject a fill outright once it lands outside a set range.
Checking the economic calendar and staying out of new entries around high-impact releases takes one predictable source of drift off the table. Splitting larger orders into smaller pieces, standard practice in algorithmic trading, reduces the market impact a trade creates on its own.
A broker's execution model and infrastructure sit outside a trader's control trade by trade and matter at least as much as order tactics. B2PRIME's RAW account, for example, is priced starting $2.50 per lot per side on B2TRADER and TradingView, and $2.90 per side on cTrader, with no last-look execution on any of the three trading platforms.
Lower cost alone does not determine outcomes. Neither pricing nor the absence of last look guarantees slippage will not occur. Both do remove one layer of execution-side uncertainty on top of ordinary market risk, a factor to weigh alongside risk management tools and position sizing.
Recurring slippage deserves a two-part investigation. Market conditions explain a real share of it, a share no broker can execute around when market volatility spikes or the book thins. The rest belongs to the execution model, which covers dealing-desk intervention, routing, and disclosed practices like last look. A trader can evaluate and compare that side before choosing where to trade.
[[aa-cta]]
Three Platforms, One RAW Account
One RAW account covers B2TRADER, TradingView, and cTrader, so the platform choice stays open after onboarding.
CFDs are complex instruments and come with a high risk of losing money rapidly due to leverage. You should consider whether you understand how CFDs work and whether you can afford to take the high risk of losing your money. Crypto CFDs carry additional risks due to the high volatility of the underlying assets. Losses can exceed the amount initially deposited.
This content is for informational and educational purposes only and does not constitute investment advice or a personal recommendation. Nothing here, including the worked fill examples, is an instruction to place or avoid any order. B2PRIME (B2B Prime Services EU Ltd) is authorized and regulated by the Cyprus Securities and Exchange Commission (CySEC), license no. 370/18; product availability, eligible collateral, and leverage depend on the client's jurisdiction and applicable terms. The pip and cost figures shown are simplified illustrations of mechanics rather than expected outcomes. Past performance is not indicative of future results, and pricing, execution figures, and third-party data are indicative and may change; verify current details before trading.
[[/a]]
[[aa-faq]]
FAQs about Slippage in Trading
What is slippage in trading, and why does it happen?
Slippage is the difference between the price expected on an order and the actual price received. Prices keep moving between order submission and execution, where even a fraction of a second shifts the fill.
Is slippage always bad, or can it work in a trader's favor?
Either way. Positive slippage returns a better price than requested, and negative slippage a worse one. Neither is inherently a problem. The price direction between submission and fill decides which one occurs, leaving most traders with a mix of both over time.
How can I tell if slippage is caused by the market or by broker execution?
Compare requested and filled prices across a meaningful number of trades, then segment by session, order type, and instrument. Slippage clustering around known volatility (news, thin sessions, gaps) generally points to market conditions. Slippage that's persistent, one-sided, and present even in calm conditions is reason to look more closely at broker execution.
Do limit orders prevent slippage?
Not entirely, but they cap it. A limit order will not fill at a worse price than set, which controls the downside at the cost of a fill that may never arrive if the market moves past that level. Market orders put the fill ahead of the price.
How can I reduce slippage, and does a broker's execution model matter?
Smaller order sizes, limit or stop-limit orders where appropriate, and avoiding entries around major news releases all help. Execution model and infrastructure matter too: B2PRIME's RAW account is priced at $2.50 per lot per side on B2TRADER and TradingView, and $2.90 per side on cTrader, with no last-look execution on any of the three. This does not remove market-driven slippage, but it removes execution-side uncertainty layered on top of it.
[[/a]]
Connect with Our Experts
Our team is equipped to provide solutions precisely to your requirements. Let's explore your options and discuss how we can support your objectives