Oops! Something went wrong while submitting the form.
Notice: It looks like you are visiting us from United Arab Emirates or have selected it as your residency location.
For accurate information and services under the correct licensed entity, please visit the appropriate section of our website. For more information view Regulatory Information
For accurate information and services under the correct licensed entity, please visit the appropriate section of our website. For more information view Regulatory Information
The popular charting platform TradingView offers its users access to over 100,000 community-built technical indicators. This large collection of tools is intended to provide traders with more ways to analyze the market.
And yet, a stark paradox remains: available data consistently show that many retail traders fail to achieve consistent profitability. This points to a fundamental disconnect between piling more indicators onto a chart and actually making better trading decisions.
Price action trading is a direct response to this complexity. This beginner trading guide provides a foundational breakdown of this approach.
[[aa-key-takeaways]]
Key Takeaways:
The price chart can provide a significant amount of the market information, often reflecting available known news, data, and sentiment in real-time.
The core of the approach is to minimize the use of indicators like RSI or MACD, which are based on past data, and focus on the live price analysis.
A candlestick pattern may be more significant if it appears at a key market level, such as a major support or resistance zone.
[[/a]]
What Is Price Action Trading?
Price action trading is a methodology based on a single, powerful premise: much of the information a trader may consider to make a decision is already reflected in the price itself. It is the art and science of reading a "naked" chart, free from the clutter of lagging indicators.
This approach taps into a core tenet of Dow Theory: the idea that the market discounts everything. It assumes that all known news, economic data, and investor sentiment are already reflected in the price you see on your chart.
For this reason, many traders argue that price action can be a relatively pure and reliable source of information out there. You're observing aspects of the market's collective psychology—such as fear, greed, and indecision—as they may be reflected in real-time.
Trading Without Indicators
Most common technical indicators, like the RSI or MACD, are derivatives of price. They are mathematical calculations based on past price data. By their very nature, they often lag behind what the price is doing right now.
Instead of analysing a lagging formula, a price action trader focuses on the movement and patterns of the price bars or candles themselves.
It's important to note that price action trading is not solely a mechanical, rule-based system. It’s better to think of it as a discretionary skill developed over time through long hours of practice and careful market observation.
It is about learning to interpret possible market dynamics:
Which participants can influence the market?
Is the market caught in a trend or moving sideways in consolidation?
Is momentum building or fading?
The Building Blocks: Approaches to analyzing a Price Chart
A price action trader analyzes the market through three fundamental lenses: the patterns formed by individual candlesticks, the broader market structure, and the key horizontal levels of support and resistance.
1. Candlestick Analysis: The Language of the Market
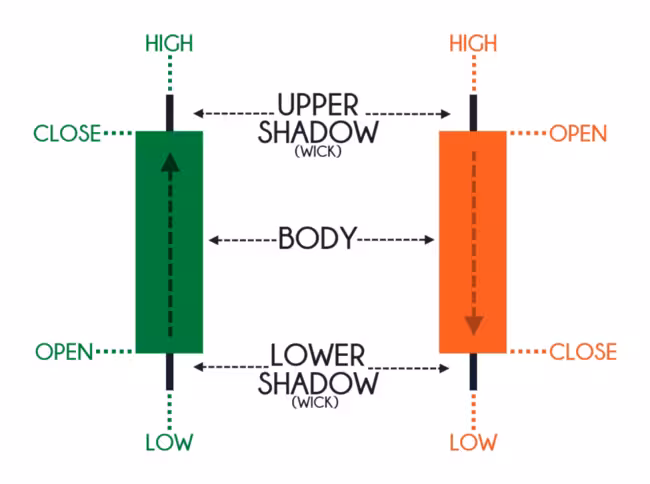
Every candlestick on the chart reflects the interaction between buyers and sellers within a specific timeframe. A candlestick analysis begins with understanding its two main parts.
The candle's thick "body" shows the opening and closing prices, while the thin "wicks" (or shadows) reveal the most extreme highs and lows of that particular battle.
So, seeing a long wick poke out from the top of a candle is a visual clue that buyers attempted a rally but were ultimately overpowered by sellers who won the session. This may provide a subtle indication of possible market momentum.
2. Market Structure: Identifying the Trend
Market structure is the overall framework of the price chart. It can help to identify the possible trends in the long term.
An uptrend can be identified by a pattern of higher highs and higher lows. This pattern may indicate that buyers are active. A downtrend, by contrast, can be identified by lower highs and lower lows, suggesting sellers are active.
A market that is not making new highs or lows is in a consolidation or range-bound phase. As a trader, one important step to identify the current market structure; this framework may help inform traders of potential trading directions.
3. Support and Resistance: The Market's Memory
Support and resistance levels are the horizontal zones on a chart that have historically caused the price to react.
A support level forms in a price zone where buying pressure has previously proven strong enough to halt a decline and push prices higher. Resistance is the inverse: a zone where selling pressure has consistently overwhelmed buyers and capped rallies.
These levels can be seen as levels where price has previously reacted. An astute price action trader pays careful attention when the price returns to these historical zones, as these areas may present potential trading opportunities.
Key Candlestick Patterns Every Beginner Should Know
While any single candlestick offers a useful glimpse, certain sequences of candles may provide possible indications about the market's next intention. An experienced price action trader typically becomes familiar with several commonly observed patterns, always remembering that the context of where a pattern appears matters more than the pattern itself.
Pattern Spotlight: The Pin Bar
What It Looks Like: Visually, a Pin Bar is easy to recognise by its long, protruding wick (or "tail") and a small body. It often goes by other names, like a Hammer (in a bullish context) or a Shooting Star (in a bearish one).
What It Signals: In practice, this pattern may indicate potential rejection of a specific price, which could suggest that a possible reversal against the prevailing trend.
A long upper wick may indicate that buyers pushed the price up aggressively during the session, but sellers regained control and pushed the price back down. This could be interpreted as a signal of seller strength. A long lower wick shows the exact opposite scenario.
A Pin Bar may be more meaningful if it forms at a key support or resistance level after a sustained trend. A random Pin Bar in the middle of a choppy range may not provide clear signals.
Pattern Spotlight: The Engulfing Pattern
What It Looks Like: The Engulfing Pattern is a dramatic two-candle formation that can indicate a possible shift in power. It appears when the body of the second candle completely swallows the body of the previous one, which may suggest momentum change.
What It Signals: It may suggest a possible shift in the market's momentum. A bullish engulfing formation may indicate buyers have gained control from sellers, with the bearish version implying a shift in the opposite direction.
A bearish engulfing candle may indicate that buyers started the session in control, only to be overwhelmed by sellers who entered with enough force to erase all the initial gains and even close below the prior session's low. This could be interpreted as a possible sign of shift in sentiment.
Just like a Pin Bar, the Engulfing Pattern may be more relevant when it appears after a sustained trend and at a key support or resistance level.
Pattern Spotlight: The Inside Bar
What It Looks Like: An Inside Bar formation may reflect temporary market indecision. This two-candle pattern is visible when a smaller, second candle is completely contained within the high-to-low range of the larger "mother bar" before it.
What It Signals: The pattern may indicate a brief pause while the market consolidates, possibly before the next move.
An Inside Bar may suggest a moment of indecision. The market can pause after a strong move. Traders may be waiting to see if the current trend continues.
The most common price action strategy for an Inside Bar is to trade the breakout. A trader may place an entry order just above the high or below the low of the mother bar, anticipating that the market could continue in its original direction after the pause.
A Simple Price Action Strategy for Beginners
A well structured price action strategy is a simple, repeatable process built on a clear set of rules for identifying potential trading opportunities. What follows is a basic strategy that focuses on trading possible reversals from key market levels.
Step 1: Identify a Key Level on a Higher Timeframe
First, focus on higher timeframes. Open a daily or 4-hour chart and identify a notable level of horizontal support or resistance. This could be a price zone where the market has reversed multiple times in the past. This may serve as your reference point
Step 2: Wait Patiently for Price to Reach Your Level
This step requires discipline. Avoid chasing the market. Your job is to wait for the price to approach your pre-defined level of interest. This may take hours or even days. A professional trader typically waits for their specific setup to appear; they avoid forcing a trade.
Step 3: Watch for a Clear Confirmation Signal
Even if the price reaches your key level, that is not an automatic signal to jump into a trade. You should wait for the market to provide a possible candlestick analysis signal that suggests a potential reversal. This may include patterns like a Pin Bar or an Engulfing Pattern.
Step 4: Execute with a Defined Plan
Once you have your signal, you may develop a trade plan around it.
Entry: Consider placing your entry order based on the signal. For a bullish Pin Bar, for example, a common entry could be to place a buy stop order just above the high of the pin bar candle.
Stop-Loss: Your risk should be clearly defined. The stop-loss for a long trade could be placed just below the low of the Pin Bar. This may serve as your invalidation point.
Profit Target: Your initial profit target could be set at the next possible area of opposing market structure, such as the nearest significant resistance level.
This structured, four-step process—level, test, signal, and execution—may form part of a disciplined price action trading approach.
The Psychology of a Price Action Trader
A wel strctured price action strategy is built on a foundation of mental discipline. The ability to read a chart is a technical skill, but the ability to act on that information without emotional interference can distinguish traders with consistent results from the rest.
The Discipline of Patience
A professional price action trader recognizes that much of their time can be spent waiting. They are not looking for constant action; they are waiting for a possible, high-quality setup to form at a pre-defined level of interest.
Amateur traders often feel the need to be in the market at all times. This can contribute to taking lower-quality trades out of boredom or impatience. A professional, however, may exercise the discipline until the market presents an opportunity that aligns with their criteria.
The Non-Negotiable Stop-Loss
Price action trading is a game of probabilities. Losing trades is possible. Real trading discipline often involves a key principle: sticking to your pre-defined stop-loss on every trade.
Shifting your stop-loss simply because a trade is moving against you can significantly increase the risk of losses. A professional can accept a small, defined loss and move on to the next opportunity.
Thinking in Probabilities
Many price action traders aim to think like a risk manager first and a market speculator second. The objective is not to be right about every trade, but to pursue profitable trades to outweigh the losing ones over time.
This mindset can be important. It reduces the emotional need to "win" on any single trade and shifts the focus to the disciplined execution of a strategy that may havea positive statistical expectancy over time. This may reflect the approach of trading without indicators—managing risk based on market structure, rather than relying on lagging signals.
Conclusion
Developing proficiency in price action trading is the skill of interpreting possible market dynamics directly from a clean chart, assessing whether buyers or sellers may be more active—and identifying potential key levels.
This skill typically isn't developed quickly. It requires significant time, consistent practice, and a strong focus on risk management.
The path to achieving proficiency in naked chart trading, for many, begins with begoming familiar with one simple, commonly observed strategy. Learning to execute that one strategy with consistent discipline may help build the foundation for a trading approach.
Disclaimer: This article is for educational purposes only and should not be considered financial advice. All trading involves significant risk and is not suitable for all investors. You should consult with a qualified professional before making any financial decisions.
[[aa-faq]]
FAQs
Is price action a good trading strategy?
How effective it is will always depend on an individual trader's skill, discipline, and approach to risk management. For many professionals, it forms important part of their trading approach.
How do you read price action?
You read price action by analysing three key components on a clean chart: the overall market structure (the trend), key support and resistance levels, and individual candlestick patterns created at those levels.
Does SMC trading really work?
Smart Money Concepts (SMC) is an advanced and more complex form of price action trading that focuses on concepts like liquidity and order blocks. Like any strategy, its success is not guaranteed and depends on the trader's skill.
What is the best timeframe for price action trading?
Beginners could start on higher timeframes like the daily or 4-hour charts. The signals on these timeframes may be more consistent and help reduce some of the market "noise" seen on lower timeframes.
[[/a]]
Connect with Our Experts
Our team is equipped to provide solutions precisely to your requirements. Let's explore your options and discuss how we can support your objectives


.svg)


.avif)
.avif)
.avif)
.avif)
.avif)