Oops! Something went wrong while submitting the form.
Notice: It looks like you are visiting us from United Arab Emirates or have selected it as your residency location.
For accurate information and services under the correct licensed entity, please visit the appropriate section of our website. For more information view Regulatory Information
For accurate information and services under the correct licensed entity, please visit the appropriate section of our website. For more information view Regulatory Information
If you have ever watched price spike just above a clean high, trigger your stop, and then reverse, this may reflect buy side liquidity. It is a commonly misunderstood event on a chart: what looks like a failed breakout may reflect a move toward resting orders.
This guide explains what buy side liquidity is, where it forms, why larger participants may gravitate toward it, and how traders may read the reaction that follows, across forex, crypto, and equity CFDs.
[[aa-key-takeaways]]
Key Takeaways
Buy side liquidity is the pool of buy stop orders sitting above swing highs, equal highs, and obvious resistance, where short sellers' stops and breakout orders cluster.
Larger participants may be drawn to these zones because that is where enough resting orders exist to fill sizable positions without chasing price.
You can map buy side liquidity by marking recent swing highs, equal highs, and round numbers, and treating them as zones rather than exact lines.
After a sweep, price may reverse (a stop-run into liquidity) or continue (a genuine breakout); the reaction becomes readable only once the candle closes.
Buy side liquidity is an observation about order flow, not a signal that guarantees direction, and it works the same across forex, crypto, and equity CFDs.
[[/a]]
[[aa-cta]]
Read Order Flow Across Every Market
B2PRIME's unified cross-collateral account puts Crypto Spot, Crypto Perpetual Futures, and CFDs on forex, indices, and commodities in one balance.
Buy side liquidity refers to the buy orders resting above the current price, primarily buy stop orders. Two groups place them: traders holding short positions who set protective stops above a high, and breakout traders who queue buy stops to enter if price clears resistance. Stacked together, these orders form a pool of resting buy orders that execute if price reaches them.
The term causes confusion because "buy side" also describes a category of market participant. It is worth separating the two meanings.
Buy Side Liquidity vs. Sell Side Liquidity: What's the difference?
In market-structure terms, "buy side" and "sell side" describe where orders rest, not who places them:
Buy side liquidity sits above price, as buy stops above highs and resistance. When it is swept, resting buy orders execute.
Sell side liquidity sits below price, as sell stops below lows and support. When it is swept, resting sell orders execute.
This is distinct from the traditional finance meaning, where the "buy side" refers to institutions that invest capital (asset managers, pension funds) and the "sell side" refers to firms that provide execution and pricing (banks, brokers, market makers). In an order-flow or ICT/SMC context, the phrase points to stop pools, not participant types. Keeping the two definitions apart makes the rest of the concept far easier to read on a chart.
Where Buy Side Liquidity Forms
Buy side liquidity tends to collect at price levels that many traders can see at a glance. The more obvious a level, the more orders tend to accumulate around it.
Swing Highs and Equal Highs
A prior swing high is the most common home for buy side liquidity. Traders who shorted near that high often place stops just above it, and breakout traders watch the same level for a move higher. Equal highs, where price stalls at almost the same level two or more times, concentrate these orders even further. A double or triple top that looks like obvious resistance to retail traders may also read as a pool of resting buy orders to larger participants.
Resistance Levels and Round Numbers
Horizontal resistance zones and psychological round numbers attract the same behaviour. Round figures such as 1.1000 in EUR/USD, $70,000 in Bitcoin, or a whole-number handle on an index CFD tend to gather stops and pending orders because so many participants anchor decisions to them. Session highs and prior-day highs work similarly. None of these levels predict direction on their own; they simply mark where orders are likely to be resting.
Why Institutions Target Buy Side Liquidity
Large orders have a practical problem: filling size without moving price against yourself. A participant who needs to buy a substantial position cannot simply lift every offer, because doing so drives the price up and worsens the average fill. Areas of buy side liquidity may be useful to watch, because a sweep above a high can bring orders into play..
This is an observation about market microstructure rather than a claim about any specific actor's intent. The point for a trader is mechanical: where resting orders cluster, price often reacts, and understanding that can reframe a "stop hunt" as ordinary order-flow behaviour. For a broader view of where hidden liquidity sits, our dark pool trading guide for investors explores venues where large orders are worked away from the visible book.
How Liquidity Sweeps Work
A liquidity sweep is a move that pushes just beyond an obvious level, triggers the resting orders there, and then often snaps back. The sequence typically looks like this: price approaches a marked high, spikes through it (frequently on a long wick), fills the stops and breakout orders sitting above, and then either reverses sharply or holds and continues. The sweep itself is neutral information; it confirms that orders were taken, not what happens next.
How to Identify Buy Side Liquidity on Charts
Reading buy side liquidity starts by marking levels where orders are likely to rest, before price gets there. It is a preparation exercise, not a prediction.
Practical Identification Steps
Mark recent swing highs. On your chosen timeframe, highlight the clear highs where price previously reversed. These are your first candidate zones.
Flag equal highs. Where two or more highs sit at almost the same level, mark the zone; clustered orders are more likely there.
Add round numbers and session highs. Note nearby psychological levels and the prior session or prior-day high.
Draw zones, not lines. Give each level a small band rather than a single price, since wicks routinely pierce exact levels without meaning a true break.
Wait for the reaction. Once price reaches a zone, watch how the candle closes rather than acting on the intrabar spike.
Traders may consider treating these zones as areas of interest that require confirmation, not as entry signals in themselves.
Trading Around Buy Side Liquidity
Once a level is swept, two broad reactions tend to follow. Neither is guaranteed, and the distinction only becomes clear after the fact. The examples below are illustrative and educational, not recommendations.
Sweep and Reversal Setups
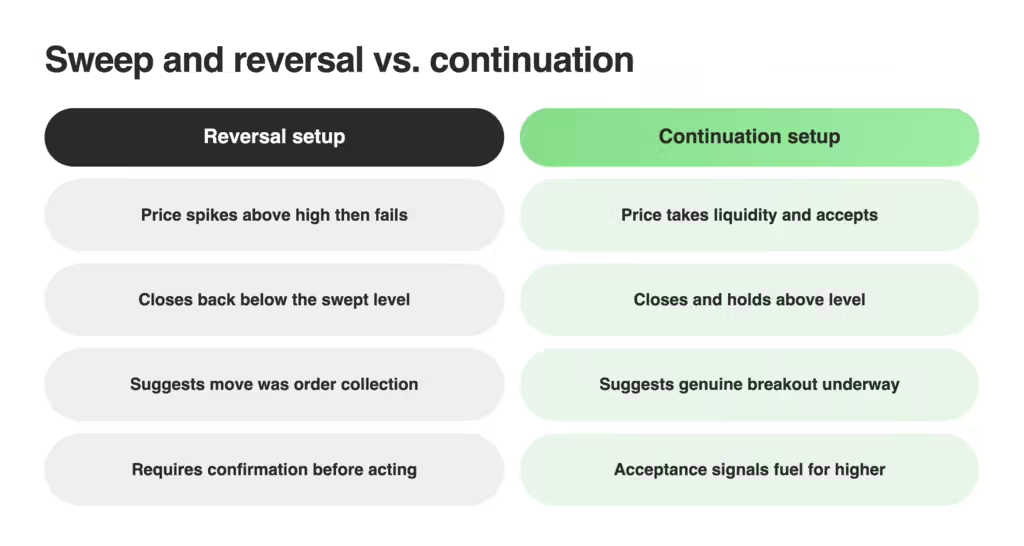
In a sweep-and-reversal, price runs above a high, fills the buy side liquidity, and then fails to hold, closing back below the swept level. This can suggest that the move above the high was driven by order collection rather than genuine demand. Traders who study this pattern may consider waiting for a decisive close back inside the range and a shift in short-term structure before assessing the reversal, rather than reacting to the wick alone.
Sweep and Continuation Setups
In a sweep-and-continuation, price takes the liquidity above a high and then accepts above it, closing and holding higher. Here the sweep may support a breakout rather than a reversal. The practical difference between the two cases is acceptance: does price close and stay beyond the level, or does it reject? That question, answered on a closed-candle basis, is what separates the two scenarios.
Common Mistakes When Trading Buy Side Liquidity
Acting on the wick. Entering the instant price spikes through a level, before any candle closes, is the most common way traders get caught on the wrong side of a sweep.
Treating levels as exact lines. A pierce of a few pips or ticks is normal. Marking zones rather than precise prices avoids premature conclusions.
Assuming every sweep reverses. Sweeps precede continuations as well as reversals. Waiting for acceptance or rejection keeps the read honest.
Ignoring higher-timeframe context. A sweep against the dominant trend behaves differently from one that aligns with it.
Skipping risk controls. Order-flow reading does not remove risk. Position sizing and predefined invalidation levels remain essential, because any setup can fail.
For a wider market context on how liquidity conditions are evolving, see the Liquidity Pulse by B2PRIME, which tracks trends and outlook across asset classes.
Apply What the Market Reveals With B2PRIME
Reading buy side liquidity is ultimately about interpreting where orders rest and how price reacts when it reaches them. That skill is only as useful as the execution environment behind it: sweeps resolve quickly, and spreads that widen at the wrong moment can distort the very levels you are watching.
B2PRIME is a multi-regulated broker offering a single unified cross-collateral account that holds Crypto Spot, Crypto Perpetual Futures, and traditional CFDs (forex, metals, indices, commodities) in one balance, with neutral tier-1 execution and transparent published conditions.
The same order-flow concepts described here apply across all of them, so a framework learned on one market can be observed on another. Traders who want low, transparent costs to study these reactions can explore the B2PRIME RAW account, priced from $2.50 per lot per side with no minimum deposit.
[[aa-cta]]
One Account, Every Liquidity Zone
Track buy-side and sell-side liquidity across forex, indices, commodities, and crypto from a single cross-collateral account, and use spot crypto as margin for CFD positions.
CFDs are complex instruments and come with a high risk of losing money rapidly due to leverage. You should consider whether you understand how CFDs work and whether you can afford to take the high risk of losing your money. Crypto CFDs carry additional risks due to the high volatility of the underlying assets.
This content is for informational and educational purposes only and does not constitute investment advice or a personal recommendation. B2PRIME (B2B Prime Services EU Ltd) is authorised and regulated by the Cyprus Securities and Exchange Commission (CySEC), licence no. 370/18.
[[/a]]
[[aa-faq]]
FAQs about Buy Side Liquidity
Is buy side liquidity bullish?
Not inherently. Buy side liquidity simply marks where buy orders rest above price. When it is swept, the reaction can be bullish (a continuation higher) or bearish (a reversal back down). The direction only becomes readable once price shows acceptance above the level or rejects it on a candle close, so the pool itself is neutral information.
How do you mark out buy side liquidity?
Mark the recent swing highs, any equal highs, and nearby round numbers or session highs on your timeframe, and treat each as a small zone rather than an exact line. These are the areas where buy stops and breakout orders are most likely to cluster. Marking them in advance turns liquidity reading into preparation rather than prediction.
What happens when buy side liquidity is swept?
Price pushes just above the level, triggering the resting buy stops and breakout orders, which can cause a brief burst of buying. After that, price either reverses (a stop-run into liquidity) or holds and continues higher (a genuine breakout). The sweep confirms orders were filled; it does not confirm what happens next.
What is the difference between buy side and sell side liquidity?
Buy side liquidity rests above price as buy stops above highs and resistance, while sell side liquidity rests below price as sell stops below lows and support. In this order-flow sense, the terms describe where orders sit, not the type of participant. This differs from the traditional finance meaning, where "buy side" and "sell side" describe investing institutions versus execution firms.
Can retail traders use buy side liquidity concepts?
Yes. The concepts are observational and require only a chart, so retail traders can mark liquidity zones and study how price reacts to them across forex, crypto, and equity CFDs. They are best treated as a way to understand order-flow behaviour rather than as a standalone strategy, and they do not remove the need for disciplined risk management.
[[/a]]
Connect with Our Experts
Our team is equipped to provide solutions precisely to your requirements. Let's explore your options and discuss how we can support your objectives



.svg)

.avif)
.avif)