Oops! Something went wrong while submitting the form.
Notice: It looks like you are visiting us from United Arab Emirates or have selected it as your residency location.
For accurate information and services under the correct licensed entity, please visit the appropriate section of our website. For more information view Regulatory Information
For accurate information and services under the correct licensed entity, please visit the appropriate section of our website. For more information view Regulatory Information
In this report, B2PRIME Group, a global financial services provider for institutional and professional clients, presents a comprehensive overview of key market developments in 2025 and their implications for trading activity and liquidity in 2026.
Throughout 2025, a combination of macroeconomic shocks and rapid technological innovation was shaping liquidity in financial markets. Elevated volatility was changing investor preferences, and the increasing influence of automation and digital assets defined the year. Key trends that prevailed in 2025 included:
Elevated volatility: Geopolitical and macroeconomic shocks (trade wars, political conflicts) drove sharper swings across equities, metals, and currencies.
Safe-haven demand: Gold and other precious metals attracted significant inflows amid concerns over U.S. debt and global instability.
Shifting currency dynamics: The U.S. dollar’s dominance in international settlements declined, while the euro and yen responded differently to monetary policy and liquidity flows.
Growth in institutional crypto adoption: Digital assets have matured into an investable class, with ETFs and deeper liquidity facilitating mainstream participation.
Expansion of automated trading: AI-driven algorithms and high-frequency strategies increasingly dominate execution, reshaping market liquidity and structure.
Altogether, these trends set the stage for significant moves across individual asset classes. To better understand how the markets were moving, the following section presents market data, highlighting the performance and dynamics of metals, cryptocurrencies, forex, and equities throughout 2025.
The market in numbers
Metals
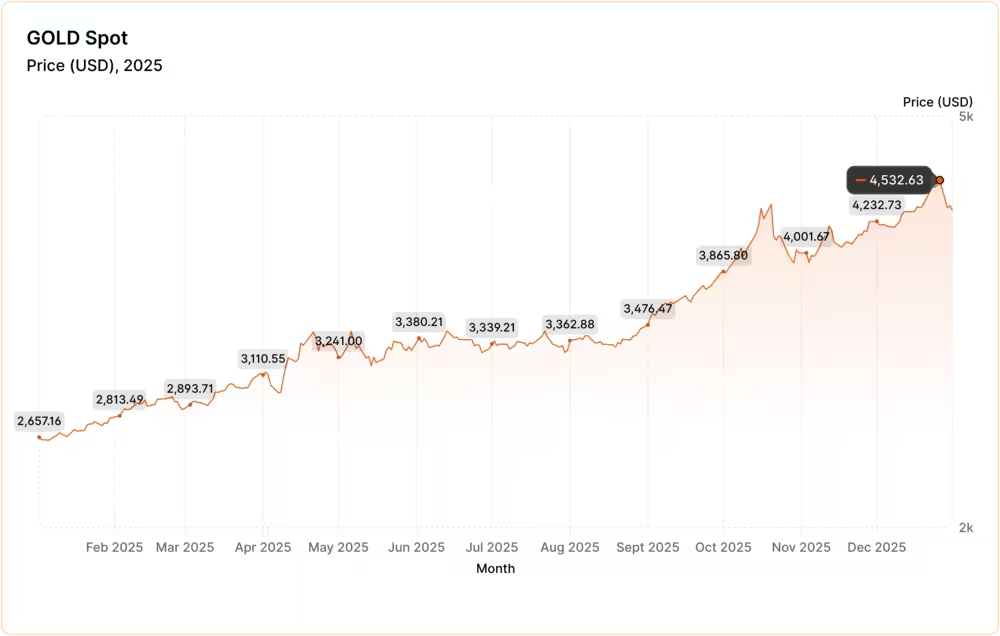
Gold became the defining asset of 2025. After starting the year at around $2,750–2,800 per ounce for spot gold early on, by late March it had already elevated to $3,150 threshold.Driven by fears over global instability and increased demand from investors seeking a “safe haven,” the rally accelerated through spring and summer.
October marked a turning point in gold’s rally, as it surged past $4,000 for the first time.It was a year-to-date gain of 50-54%, placing gold among the best-performing assets globally in 2025.For B2PRIME clients, gold was a frequently traded metal, often representing significant metals exposure and acting as the key “risk barometer” in observed flows.
The overall surge was driven by a mix of factors beyond fear. For example, one reason behind it was the Fed's dovish monetary policy, which has made interest-bearing assets less attractive and gold more appealing to investors. In addition, funds flowed into gold amid a weakening dollar and rising U.S. debt, which surpassed $38 billion and raised significant concerns this year.
Gold’s price was also driven by massive demand from central banks. In the first quarter of 2025 alone, central banks added about 244 tonnes of gold to their reserves. As global uncertainty lingered, more than two dozen national central banks, in emerging markets in particular, opted to strengthen their gold holdings rather than rely on dollar assets
As of the start of 2025, silver was trading at around $30 per ounce. But by December, silver had set new records and crossed $60 for the first time. That’s a roughly 100 -110 % increase on the year, significantly outperforming many other assets, including gold.
The explanation for this rally, however, is not speculative urge alone. Silver is widely used in manufacturing. Global industrial demand reached a record of about 680.5 million ounces in 2024 alone.Industries such as photovoltaics (solar panels), electric vehicles, electronics, and other “green economy” and tech applications absorbed vast amounts of silver, even as traditional silver-use sectors (jewellery, silverware, coins/bars) weakened.
At the same time, silver production and supply remained constrained. Total mine output and recycling increased only modestly, which was insufficient to meet surging demand. Reported unexplored capacity was around 530,000 metric tons, yet the overall world’s silver supply remained inadequate for the constantly increasing demand. As a result, for the fifth consecutive year through 2025, the market recorded a structural supply deficit.For 2025, that deficit was estimated between ~117 and ~149 million ounces, creating a tight, inelastic supply curve that magnified price moves.
Cryptocurrencies
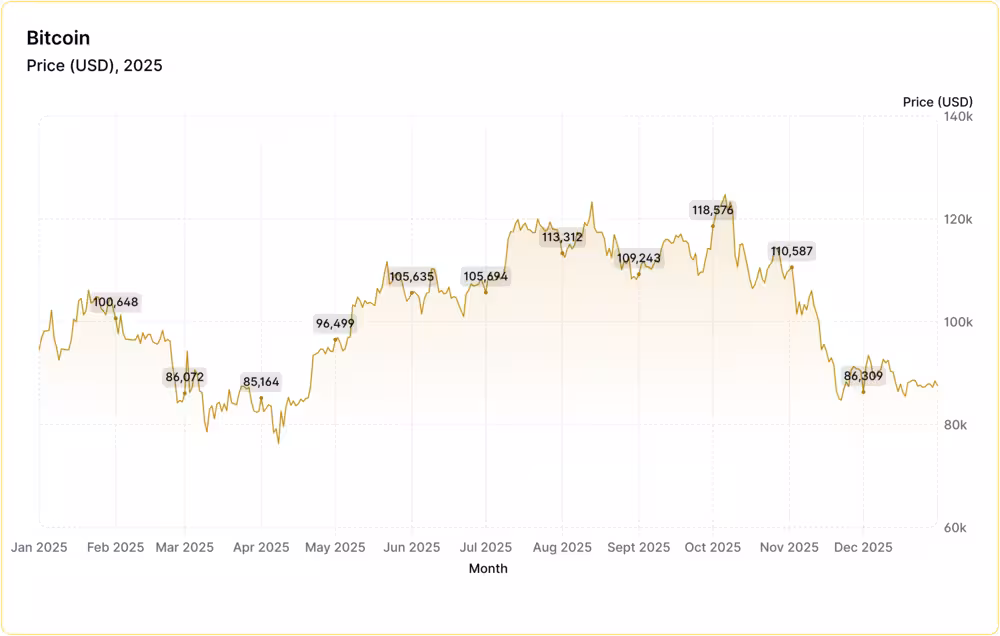
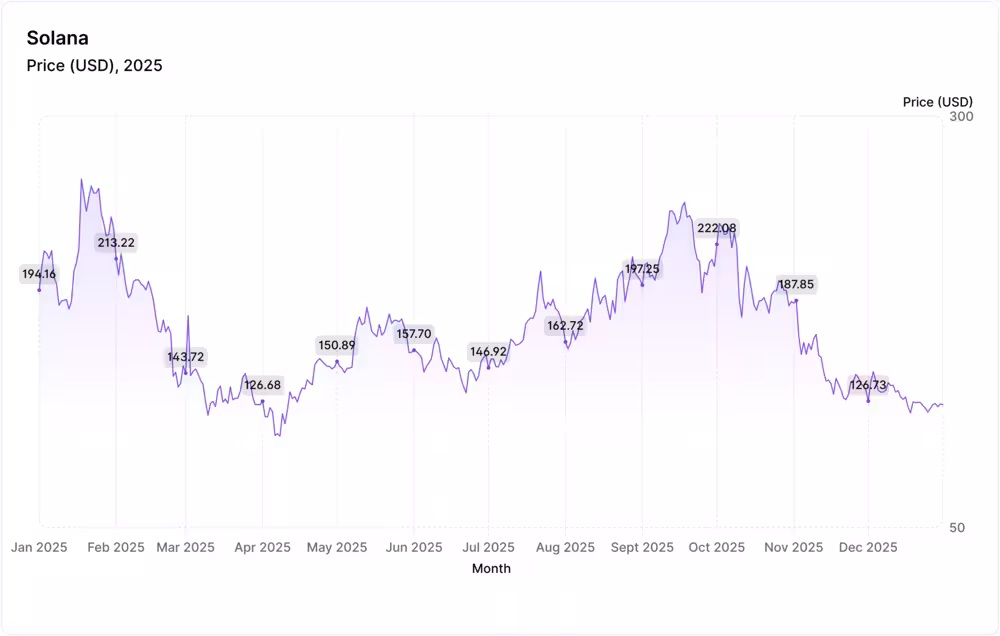
For the most significant crypto assets, 2025 has become the year they have established themselves as a more mature and trustworthy market, integral to the system. Bitcoin and Ethereum remained the two main liquidity hubs, with high spot and derivatives volumes on major venues. The year’s movements were dominated by TON and Solana (SOL), each showing distinct performance patterns tied to macroeconomic conditions and investor demand.
Bitcoin (BTC) remained the market’s anchor, posting a significant yearly gain despite high volatility. It opened the year in the mid-$60,000s but surged to new all-time highs above $100,000 before retracing during periods of leveraged market stress.
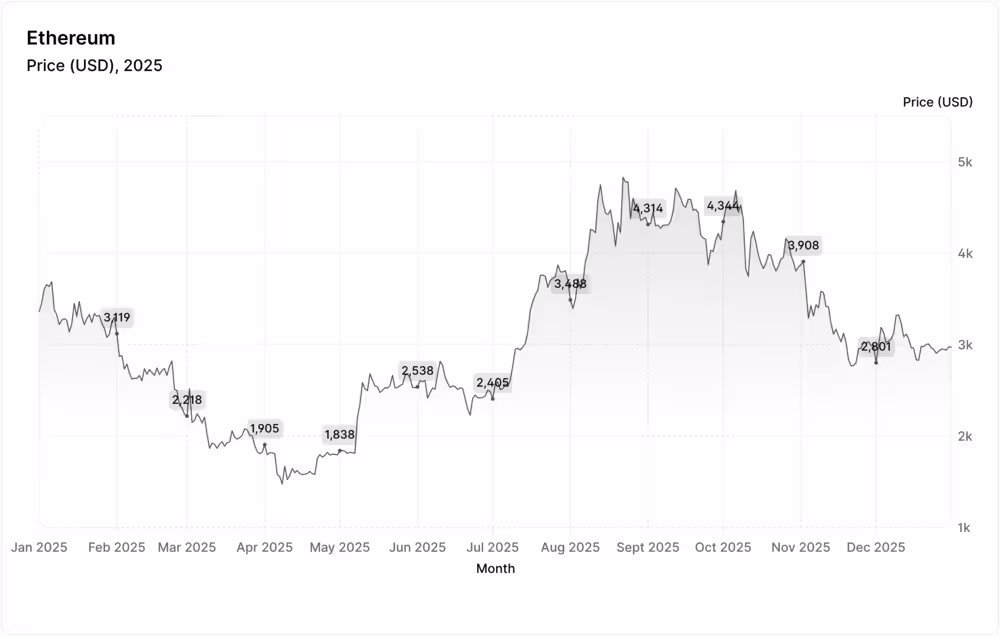
Ethereum (ETH) showed similarly solid performance: after beginning the year near $2,300, ETH rallied in response to staking participation, ecosystem expansion, and the launch of Ethereum spot ETFs, which for several weeks recorded higher net inflows than Bitcoin funds. The year's high for ETH was about $4,000.
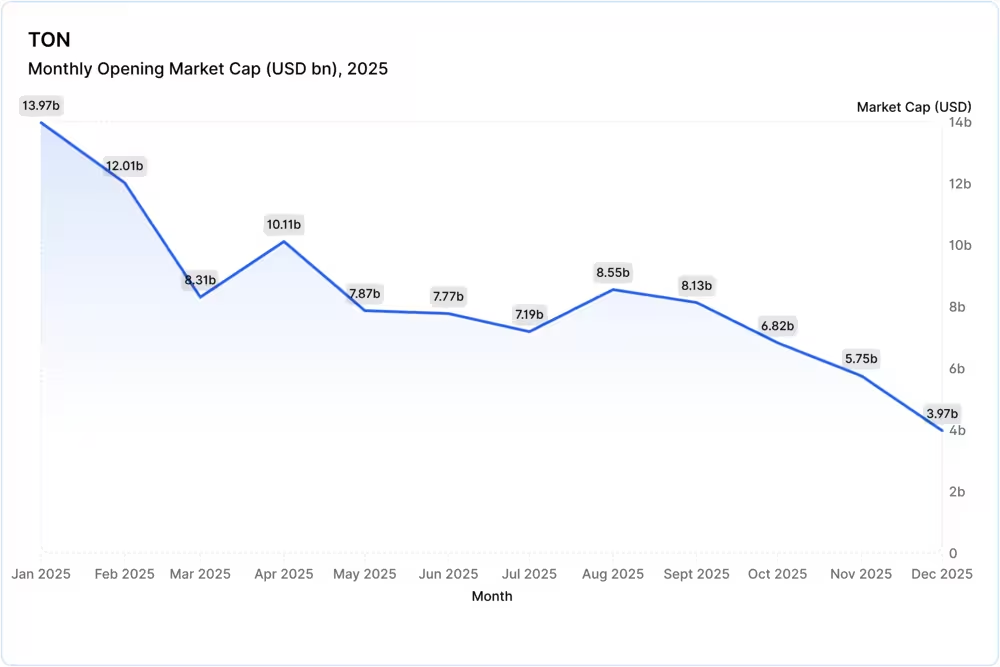
TON experienced one of the strongest growth narratives of the year. Benefiting from its integration with Telegram’s large user base and a shift to token economics, the asset saw rising liquidity and growing investor interest. Although its market cap placed it among the top five holdings for several months, it reached a high of $13 billion this year.
Along with these cryptocurrencies, Solana (SOL) continued its multi-year recovery, driven by high-performance infrastructure and growing institutional experimentation with Solana-based settlement solutions. As of late 2025, SOL traded around $100-130, with volatile highs and lows. Despite the price volatility at the end of the year, the network processed more daily transactions than the other major blockchains combined, generating the highest on-chain fee revenue and $6 billion in daily trading volume.
Beyond individual asset performance, 2025 was defined by rising market liquidity. The stablecoin circulation has increased, and exchange order books have been deepened. Total stablecoin market capitalization exceeded $300 billion by October 2025, up from around $200- $ 205 billion earlier in the year. This marked a nearly 50% year-to-date increase, driven by leaders such as USDT at $176 billion and USDC at $74 billion. By late 2025, supply reached a record of nearly $314 billion amid regulatory clarity, including the GENIUS Act.
ETFs remained the central driver of capital flows to cryptocurrencies. They enabled pension funds, wealth managers, and institutional allocators to participate in digital assets at scale. For 2025, Bitcoin ETFs were the dominant crypto investment product, with total AUM around ~ $121 billion globally as of late 2025.
Forex
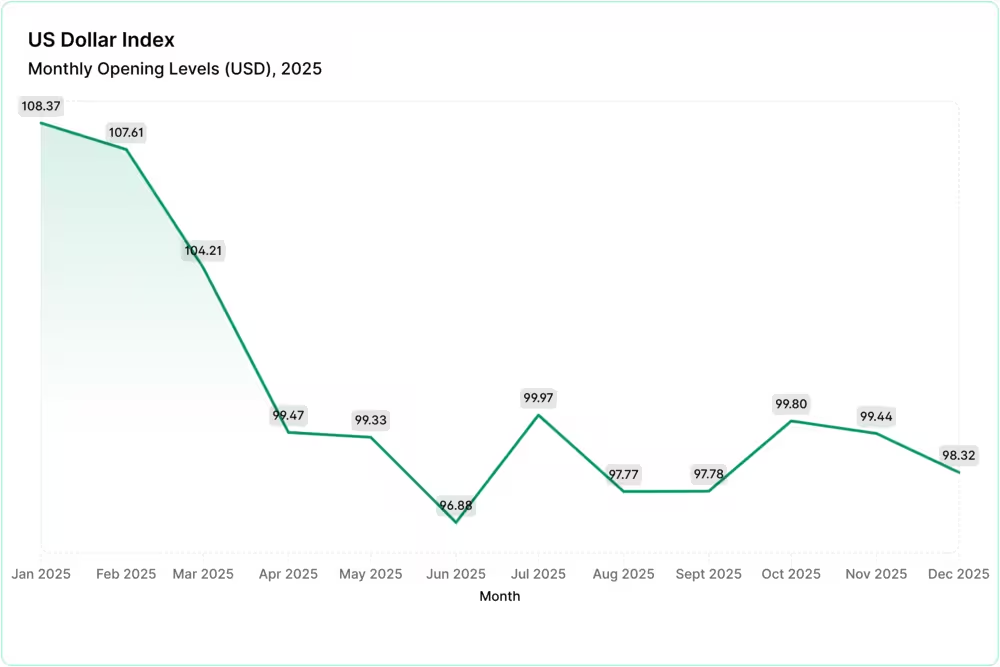
In 2025, the foreign-exchange market moved primarily in response to inflation, and throughout the year, liquidity conditions played a key role in how strongly currencies reacted to these macroeconomic changes. The U.S. dollar stayed at the center of global FX trading, although its dominance in international settlements has lessened. Because the Federal Reserve cut rates more slowly than markets expected and the US debt has surpassed a high mark, the DXY index gradually decreased from the high of 109 to the lows of 97-98.
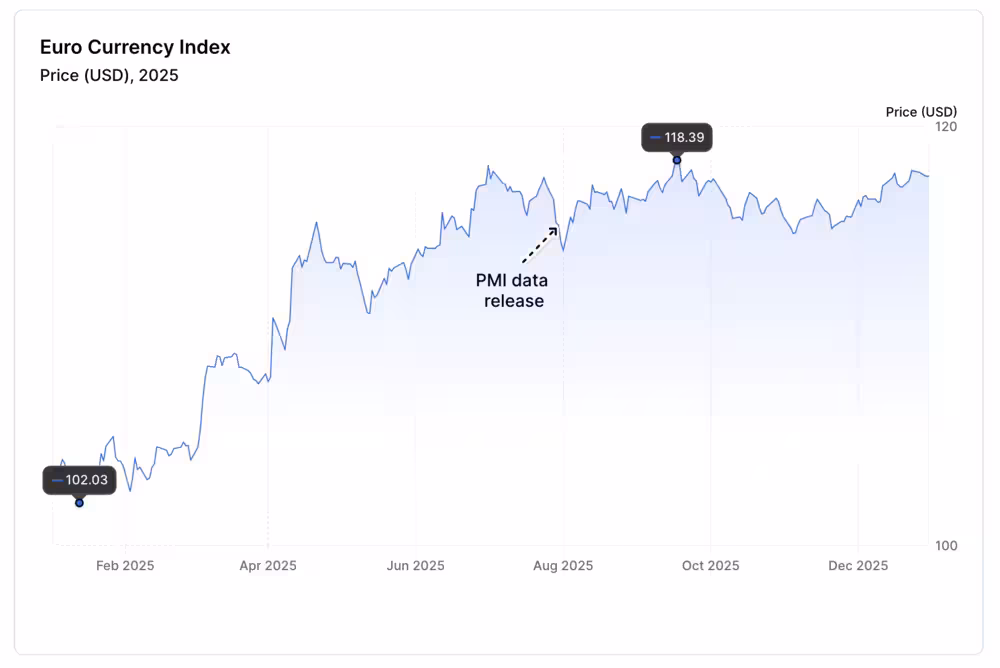
The euro faced a different environment. Eurozone inflation cooled more quickly to 2% in November, down from 2.5% earlier, leading investors to expect slightly larger rate cuts from the ECB. This kept EUR/USD in a rising trend, with prices rising from lows of 1.04 to a high of 1.17. The euro index itself was growing throughout the whole year, reaching highs of 115-116. Liquidity in euro pairs remained solid, but during weaker European data releases, such as soft PMI readings or downgraded growth forecasts, liquidity thinned just enough to let USD strength extend a bit sharply.
The Japanese yen (JPY) was one of the most sensitive currencies of the year. The BOJ’s gradual rate increases kept rate differentials wide, and USD/JPY spent extended periods above 150, at times approaching 160. Many investors used the yen in carry trades, an investment strategy in which traders borrow in a low-interest currency and invest in a higher-interest currency.
As a result, it made liquidity highly one-sided during calm, risk-on periods. When global volatility increased, especially after swings in U.S. yields, yen positions unwound quickly, resulting in sharp, sudden USD/JPY reversals. These moves often happened because liquidity briefly dried up, showing how strongly yen trading depends on market conditions.
Market indexes
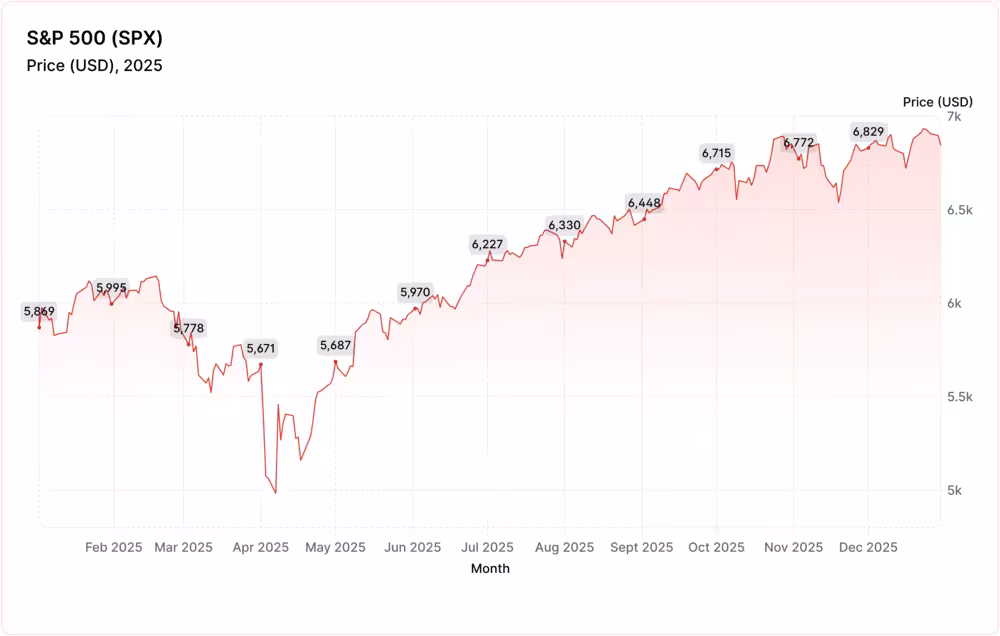
In 2025, major global equity indices showed significant regional divergence, and their performance was shaped by local liquidity. In the United States, major indices delivered solid year-to-date gains. By early December, the S&P 500 had advanced by roughly 13%, while the Nasdaq Composite climbed by about 17%, and the Dow Jones Industrial Average rose by 6%.
Strong corporate earnings, continued enthusiasm for AI and tech megacaps, and the Federal Reserve’s final rate cut to 3.5–3.75% boosted risk appetite late in the year, resulting in stronger results. Deep liquidity in U.S. equity ETFs and futures helped these moves stick, smoothing out volatility around key data releases and making it easier for institutional flows to impact prices.
Europe’s indices also performed well, often outpacing U.S. benchmarks in total returns. As of September 2025, indices like the Euro Stoxx 50 and DAX had delivered double-digit gains, for instance, DAX up close to more by 19.9% and Euro Stoxx 50 by around 16.1% year-to-date amid the industrial advancements. Persistent liquidity in European equity ETFs allowed the market to rally on improving economic data and easing monetary conditions. However, at times, thinner intra-day liquidity made European stocks more sensitive to headline news than U.S. peers.
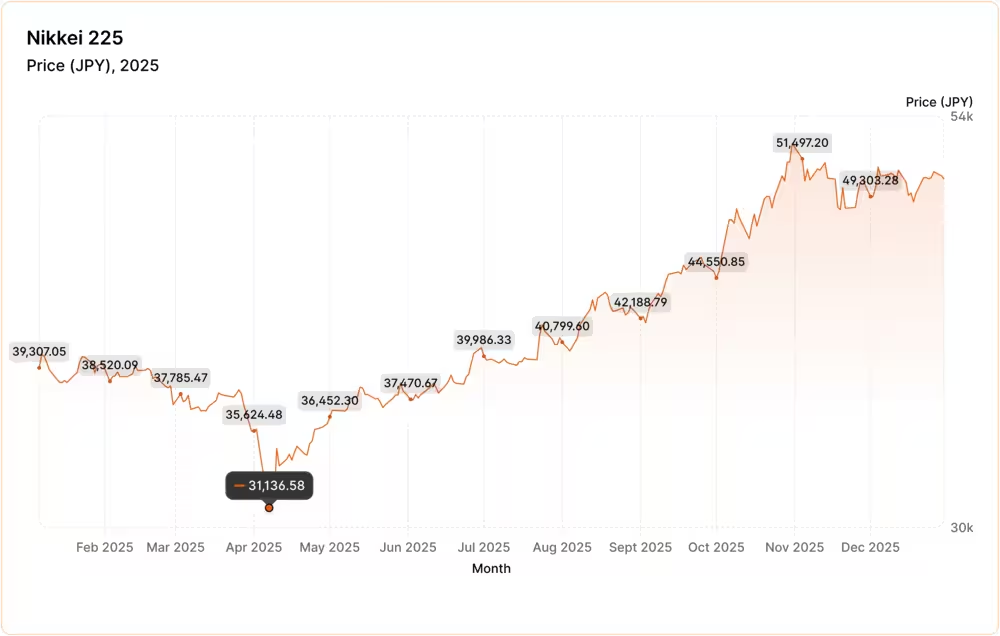
In Asia, the picture was quite confusing. The Nikkei 225 climbed roughly by 15.2% on the year, benefiting from strong exporter earnings and BOJ policy support. At the same time, foreign capital flows in late 2025 shifted, as Asian markets saw significant net foreign outflows (~$10 billion in November) amid tech valuation concerns, especially the AI rally, briefly draining liquidity from local bourses.
Technology trends
The technology landscape is changing, and the main trend of 2025 was the unprecedented growth of the algorithmic trading market. The global market for algorithmic strategies was estimated to reach $3.85 billion in 2025, with projected growth to $13.07 billion by 2035, representing an average annual growth rate of more than 13% over the next decade.
The main driver of the algotrading in recent years is the implementation of advanced AI and machine learning solutions in automated trading systems. In 2025 North America accounted for the largest share of this technology, with about 46% of the market share, and cloud platforms account for more than 54% of deployments.
This technological growth of algotrading is directly related to the growing number of small tickets and the burden on liquidity. Algorithms facilitated the execution of more than 70% of transactions in cryptocurrency trading, which significantly increased the share of automatic orders in large markets. In traditional funds, algorithms increased machine execution to about 30% of all orders on the largest exchanges, and in the Forex market, more than 35%. However, the algorithmic trading involves significant risks including execution failures and other.
With technological advancements, identifying pricing discrepancies and market dynamics became more efficient. By leveraging high-frequency algorithms to monitor and update spreads, these tools contributed to deeper market liquidity and tighter pricing. As a result, algotrading was increasingly used in 2025 alongside traditional discretionary approaches, where automated systems assisted with data processing and execution, while human decision-makers retained oversight and control.
Another key infrastructural transformation that has a big impact on liquidity and financial markets overall is a steady transition to 24/7 trading, which is already established in the crypto market and has spread to the other platforms as well. This means a round‑the-clock load on the execution, risk management, and monitoring systems, which, on the one hand, infuses the liquidity, but on the other hand, increases the burden on traders and on the provision of these systems.
Regulatory advancements
The regulatory environment developed very well this year, marking big advances across the world. Across major jurisdictions, regulators moved to demanding real, measurable outcomes. In the UK, for example, the Financial Conduct Authority pushed firms to prove that pricing, product design, and customer experiences were fair, not just compliant with disclosure rules. In the European Union, the European Securities and Markets Authority (ESMA) also stepped up its oversight, outlining how firms should evaluate and maintain effective order execution policies.
A standout development was the full entry into force of the Digital Operational Resilience Act (DORA) across the EU on 17 January 2025. DORA changed how firms must manage technology risk, cybersecurity, and third‑party service providers like cloud platforms. The law replaced older, fragmented reporting systems with a unified standard for ICT risk management and cybersecurity incident reporting. Regulators also began designating major tech vendors as “critical providers,” highlighting that resilience depends on entire service ecosystems.
Liquidity and execution quality drew attention this year. Beyond firm‑level liquidity buffers and risk frameworks, regulators recognised that liquidity is critical for stable markets. In the EU, authorities moved to keep transitional liquidity treatments in place to support securities financing transactions, which underpin money markets and funding flows. Supervisors issued new guidelines for liquidity tools in investment funds to help managers respond to stress, and industry reviews highlighted that weak liquidity practices at some firms could amplify shocks.
Crypto regulation also became more concrete. The EU’s Markets in Crypto‑Assets Regulation (MiCA) continued rolling out, requiring strong governance and authorisation for digital asset service providers. The European watchdog, ESMA, in its turn, signalled its interest in even broader supervisory powers over crypto firms to ensure consistent application across member states, a response to fragmented national approaches and rising risks as crypto interacts more with traditional finance.
Key areas to monitor for 2026
[[aa-key-takeaways]]
Trends expected in 2026:
Developments in market automation
Activity of professional participants across traditional and digital assets
Gradual easing of regulations
Expansion of “super-apps”
Performance of safe-haven assets
Institutional adoption of crypto
Potential Banks opening more to partnerships
[[/a]]
Looking ahead to 2026, markets participants may continue to explore AI‑driven tools for trading, risk management, and compliance, a trend that some asset managers may see as important to observe for the market evolution.Safe-haven assets like gold could see some movement depending on political events or unexpected geopolitical developments could make markets more volatile.
At the same time, institutions may become more active in the crypto sector. At present, institutional sentiment surveys show that nearly half of large investors are considering increase exposure to digital assets, and almost half view crypto as a legitimate investment class heading into 2026. Regulatory developments, such as the U.S. stablecoin framework and the EU’s MiCA rules, have been seen as supporting professional investors and may help liquidity. While short-term volatility may persist due to macroeconomic and political uncertainties, regulatory developments in late 2025 indicated growing interest from institutions but the overall trend towards deeper participation and more mature crypto markets remains uncertain.
Although the regulatory environment tightened in 2025, certain United States policymakers discussed modernising of rules for stablecoins and digital assets, and banks such as Bank of America expanded crypto access for wealth clients in early 2026, reflecting ongoing industry adaptation to existing regulatory frameworks.
Europe followed a cautious approach. ESMA’s 2026 work programme emphasises simplification and proportionate reporting, alongside continued efforts to build integrated capital markets across the EU, as published. At the same time, regulators introduced more detailed liquidity risk frameworks for funds, requiring managers to implement multiple liquidity management tools under harmonised rules to withstand market stress better.
We have also found that automation has contributed to growing interest in all-in-one “super-app” platforms, in which trading, payments, lending, and crypto services were offered in a single interface. Banks have begun to open up more to collaborations with fintech, seeking to leverage their agility, in exchange for access to their large customer bases and established processes.
The 2025 market developments highlighted a more stable and predictable environment; however, liquidity has increasingly consolidated around providers capable of delivering stable and institutionally structured execution across metals, crypto and major FX pairs. As the market became more automated, more regulated and more metals-driven, the role of a true Prime liquidity partner became central to operational resilience and competitiveness during 2025.
In 2025 many brokers moved away from fragmented, single-source feeds or retail-grade execution. The market leaders in 2025 were those who built their infrastructure on top of Prime-grade liquidity, with consistent pricing, low-latency routing and a multi-asset approach.
No investment advice, recommendations, or future predictions are provided in this article. Past performance does not indicate future results.
Connect with Our Experts
Our team is equipped to provide solutions precisely to your requirements. Let's explore your options and discuss how we can support your objectives


.svg)

.avif)