Oops! Something went wrong while submitting the form.
Notice: It looks like you are visiting us from United Arab Emirates or have selected it as your residency location.
For accurate information and services under the correct licensed entity, please visit the appropriate section of our website. For more information view Regulatory Information
For accurate information and services under the correct licensed entity, please visit the appropriate section of our website. For more information view Regulatory Information
Ask experienced traders: “What is a drawdown in trading?” and you’ll hear the sigh before they answer. Most traders have lived through one, but understanding them can be more complicated than it seems. There are plenty of sites and textbooks that give you a basic “drawdown definition”, describing it as a “peak-to-trough” drop that shows you how far your account slipped.
That part’s simple. What’s complicated is that trading drawdowns rarely happen neatly. MSCI’s long-term data shows U.S. equities sit below their prior highs a lot of the time, which means some form of drawdown in trading is almost always happening in the background.
It’s not just stocks, either. FX desks dealing with trillions in daily turnover know how quickly a “normal” session can sink into a sharp draw down after one bad release. The same thing happens across CFDs: liquidity looks fine until it doesn’t.
The good news? These losses usually arrive in clusters, not straight lines, which is why traders who stay in the game eventually treat drawdowns less like accidents and more like a vital sign of market pressure; something to watch, manage, and learn from.
Drawdown Meaning in Trading: What is a Drawdown?
The easy way to define drawdown in the trading market is as the reduction in capital after a run of losing trades, measured from a prior high to a later low. That’s the practical version of drawdown meaning, and honestly, it’s the one that matters.
Drawdowns are often used to measure an investment’s historical risk, or look at how different funds are performing. What’s interesting is how losses bunch together. Losing streaks show up without warning, even in strategies with a strong edge. So a trading drawdown isn’t a single bad trade; it’s the cumulative drag of several that land closer together than you’d like.
IT doesn’t always hit the whole account. A crypto sleeve inside a broader portfolio might suffer a steep dip while the rest holds steady. Account-level drawdowns and instrument-level ones aren’t the same thing, and treating them as if they are leads traders to misread their own risk.
How Trading Drawdown Works, and How to Calculate It
Honestly, the mechanics of drawdown are pretty easy to understand. Traders track the peaks and troughs in a price cycle (the highest and lowest points). Then, you measure the gap.
[[aa-cta]]
The common formula:
Drawdown (%) = (Peak equity minus the lowest point that followed) / Peak equity × 100
[[/a]]
Honestly, numbers make this easier to picture. Let’s say your account touched 20k at one point. Then a few trades later it’s sitting around 18k. Call it ten percent. A common occurrence.
Another one - you begin at 100k, grind your way up to 150k, feel good about it, and then the market slips and you’re staring at 125k. You haven’t “lost” money overall, but the fall from that high works out to roughly 16.7 percent. People miss that. They look at the starting point instead of the peak, and the math ends up feeling weird until you’ve lived through a couple of those swings.
What often gets forgotten is the recovery side. Time matters as much as depth. Some risk metrics, like the Ulcer Index or Sterling ratio, track both because traders don’t just want to know how far something fell, they want to know how long they were underwater. A shallow drawdown that drags on for months can feel worse than a sharper one that snaps back quickly.
Understanding the Types of Market Drawdown
There’s more than one way to look at, and define drawdown. Traders tend to gravitate to whichever version matches how they track risk. You’ve got:
Equity drawdown: This one stings because it includes open positions. Equity drops from a high to a later low, even if nothing’s been closed yet. For active traders in forex, CFDs, or crypto, unrealized P/L moves fast enough that an equity trading drawdown can show up long before the balance curve reflects anything.
Balance drawdown: Only closed trades count here. It’s cleaner, and it’s what most backtests use, but it misses the emotional weight of floating losses. Still, for reporting and audits, this type of drawdown is the standard.
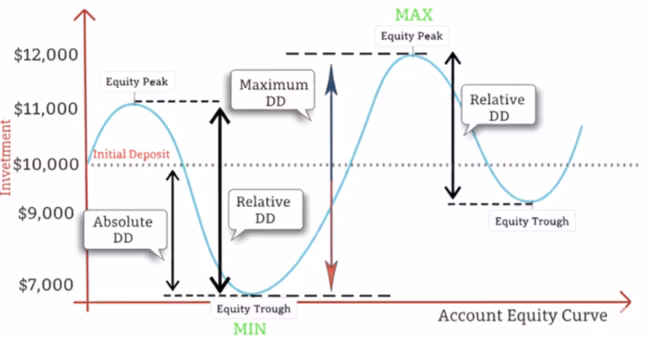
Maximum drawdown: This is the big one: the largest peak-to-trough fall over a defined period. It’s a core risk number for funds and prop programs, and there are a few variants traders bump into: daily limits, initial drawdowns, and relative drawdowns that scale with account growth.
Visual suggestion: an equity curve with each type marked in different colors so the differences are obvious at a glance.
What is Maximum Drawdown?
When traders talk about the “worst drawdown’s ever been,” they’re talking about maximum drawdown. This is the biggest historical peak-to-trough slide before the account climbs to a new high again. Simple idea, but it carries a lot of weight. Funds, CTAs, systematic desks, and everyone running external capital pays close attention to this number because it shows how far a strategy can sink when conditions turn against it.
The reason folks pay attention to this number is pretty simple. It shows how rough the worst stretch actually got. Think of an account that tops out around $15,000, then slips all the way to $9,000 before it ever finds its way back. That’s a forty percent hit. You don’t need anyone to explain why that sticks out on a performance sheet.
MDD isn’t perfect, though. It doesn’t say anything about how often these declines occur or how long recovery takes, which is why professionals pair it with other metrics when they compare drawdown profiles across strategies.
What is Drawdown in Trading? Drawdown vs Loss
One mistake you might make if you’re new to all this is treating a market drawdown as if it were the same thing as a realized loss. It isn’t. A drawdown is the peak-to-trough slide in account value (often including floating P/L).
A loss is what happens when you actually close a trade below your entry. Buy a stock at $100, watch it climb to $110, then slip to $80. That’s about a 27% drawdown from the high, but the unrealized loss is only $20 per share versus entry. Two different measurements.
You can have a profitable account and still sit in a drawdown relative to your recent peak. That gap matters because traders anchor to their highs, not their starting balance. When you ignore that distinction, you underestimate drawdown risk and overestimate how “safe” your performance actually is.
Why Drawdown Matters to Traders
If you’ve ever watched your equity curve dip after a run of bad trades, you already get why drawdowns matter. They reveal the part of trading most performance numbers gloss over, meaning how far things can slide when the market turns on you and how much work you need to dig yourself out. When the drop hits fifty percent, you need a full one hundred percent gain just to get back to break even. You don’t need a quant’s brain to feel how heavy that is.
The large-scale research paints an even sharper picture. Morgan Stanley’s 2025 study on more than 6,500 U.S. stocks found a median maximum drawdown of roughly 85%, with the average name taking about 2.5 years to reach its lowest point. Many never recover their prior peak at all. During the same period, the S&P 500’s worst drop sat closer to 58%, with far faster recovery, which lines up with what you’d expect from diversified exposure.
This is why serious traders may lean so heavily on drawdown analysis. It’s about survival, particularly when you’re trading through stressful events, like a tech bubble, or the COVID pandemic.
How to Reduce Drawdown Risk
Every trader eventually reaches the same conclusion: big setbacks usually come from simple things that were ignored for too long. Once you’ve lived through a few of them, the ways to keep drawdown risk under control may become more clear.
Keep position size small. Most traders who survive rough markets do it by risking a tiny slice of their account each time. It slows the damage during losing streaks, which show up more often than people admit.
Use leverage like it actually costs something. Because it does. High leverage turns small swings into steep drops, and you only realize that after you’ve seen a trade skid against you faster than your stop can react.
Spread exposure across uncorrelated ideas. Not just different tickers, different behaviors. When everything starts moving together, one bad theme can drag your whole book down.
Use stop-losses and trailing stops with conviction. Stops are the line between a manageable hit and a spiraling one.
Set account-level limits. A lot of seasoned traders step back automatically if their equity falls 10–15% from a peak. It sounds strict, but it’s a clean way to stop emotions from steering the next decision.
These habits may help manage drawdowns, but they can keep them from turning into something that forces you out of the market entirely.
How to Compare Drawdown Across Strategies
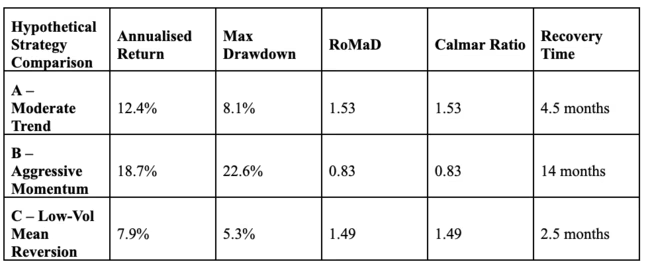
Once you start putting different strategies side by side, you realize returns don’t tell the whole story. Two systems can make the same annual number, yet the path they take to get there can feel completely different. That’s where traders try to compare drawdowns rather than just look at profits.
A momentum system might post a solid year but spend months underwater. A slower, mean-reversion setup could earn less overall but keep the equity curve steadier. When you line them up with metrics like RoMaD or the Calmar ratio, the gap becomes more obvious. Some strategies earn their keep by avoiding deep holes, not by shooting the lights out.
Some research over the years has shown a wide spread in max drawdowns for strategies that look similar on the surface. One might sit near 10–12%, another closer to 20%, even though their annualized returns aren’t that far apart.
The trick is figuring out which path you can actually live with. A strategy that looks great on paper but makes you miserable during every downturn is the one you’ll abandon at the worst possible moment.
Note: Table shows illustrative examples only. Past performance does not predict future results.
Mastering Drawdown Control
You’ll never meet a trader who enjoys dealing with drawdowns, but everyone who’s stuck around eventually respects them. They tell you the truth about your approach. When you sit down and go through your drawdown analysis, really looking at the drops and the sloppy decisions that are fed into them, you can start seeing what actually needs fixing.
The bigger traders do this constantly, almost obsessively. Retail traders end up learning the same lesson the slower way. Once you get comfortable tracking the dips, tightening your risk management when things feel off, and giving yourself time to recalibrate, drawdowns may become more manageable.
All trading carries substantial risk. You stop chasing perfection and focus on staying solvent long enough for your edge to matter, if it exists. That shift may help trading feel more disciplined.
[[aa-faq]]
FAQ
What is the drawdown in trading?
It’s the drop from a recent high in your account to a later low. The part people forget is how normal it is. Markets breathe in and out, and that dip is like the exhale. It tells you how rough the bad periods really were. That’s the whole point of the drawdown definition.
How is drawdown calculated?
You take the peak value, subtract the lowest point that followed, then divide by the peak. That’s it. If your account hit $20,000 and slid to $18,000, you’re looking at a 10% drawdown. Clean math, but it feels very different when you’re watching it happen live.
What is a good drawdown percentage?
There isn’t a magic number. Plenty of cautious traders try to keep things under 10%. Others push for more return and tolerate 15–20% swings. Once it gets deeper than that, most people start to rethink their approach. It’s as much about temperament as statistics.
How do I manage drawdown risk?
Smaller positions, honest stops, sane leverage, and knowing when you’re trading tired or emotional. These practices may help manage drawdown risk. Also start reviewing your bad stretches more carefully than your good ones, that’s usually where you figure out what really needs adjusting in your system.
[[/a]]
[[aa-cta]]
Trading carries high risk of losing funds. Drawdown analysis may help understand historical risk patterns but does not predict future performance. Past results in this article do not guarantee future outcomes.
[[/a]]
Connect with Our Experts
Our team is equipped to provide solutions precisely to your requirements. Let's explore your options and discuss how we can support your objectives


.svg)