Oops! Something went wrong while submitting the form.
Notice: It looks like you are visiting us from United Arab Emirates or have selected it as your residency location.
For accurate information and services under the correct licensed entity, please visit the appropriate section of our website. For more information view Regulatory Information
For accurate information and services under the correct licensed entity, please visit the appropriate section of our website. For more information view Regulatory Information
No corner of the global financial world exists in a vacuum. A single event can trigger chain reactions across assets that seem unrelated. The first quarter of 2025 showed this clearly: as geopolitical tensions grew, crude oil surged past $70, while a flight to safety simultaneously pushed gold prices to new highs.
These moves were not a coincidence. They were the result of the constant, dynamic relationship between three core global assets: gold, oil, and the U.S. dollar.
This guide will break down these key market correlations. Our aim is to give you a working model for considering these insights in relation to your own trading strategy.
[[aa-key-takeaways]]
Key Takeaways:
A stronger U.S. dollar typically pushes down the prices of gold and oil, as both are priced in USD globally.
The gold vs USD relationship is usually inverse — two assets often compete for the status of a global safe haven.
Rising oil prices tend to strengthen the currencies of major oil-exporting nations, like the Canadian Dollar.
These correlations are not fixed; they are dynamic relationships that shift with the global economic environment.
[[/a]]
The USD and Global Markets
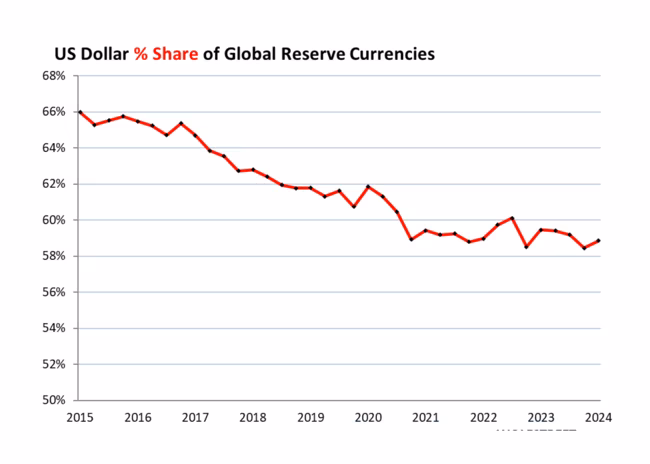
As of early 2025, data from the IMF shows the U.S. dollar still makes up nearly 60% of all official foreign exchange reserves. At the same time, the USD is a part of roughly 88% of all global FX trades.
This immense footprint makes the dollar the key influence for global markets. It is the direct reason why the world’s most important commodities, such as gold and oil, are priced and traded almost exclusively in U.S. dollars.
The Petrodollar System
To understand the dollar's grip on the world stage, we have to look back to the "Petrodollar" system. Born from the ashes of the Bretton Woods gold standard in the early 1970s, this new agreement laid down a key rule: every barrel of crude oil was to be traded in U.S. dollars, and nothing else.
This system creates a structural and sustained global demand for the currency. Every nation that imports oil must hold significant U.S. dollar reserves to pay for it, which supports the dollar's status as the world's primary reserve asset.
The Dollar's Strength
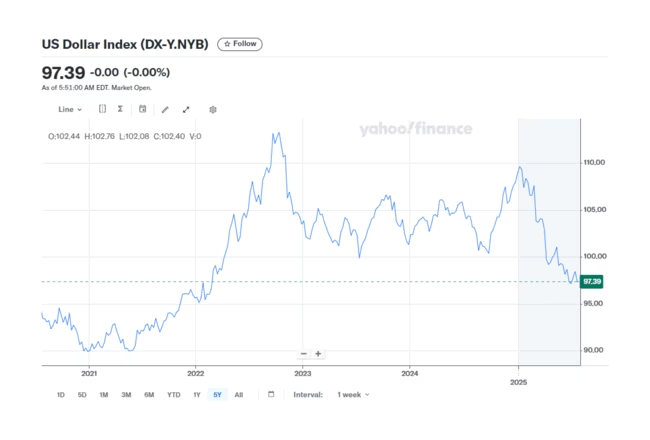
When traders want to gauge the dollar's muscle, their go-to metric is the U.S. Dollar Index (DXY). This tool measures the greenback's performance against a pool of other key currencies.
A rising DXY indicates a strengthening dollar. A falling DXY indicates a weakening dollar.
As of 2025, the DXY’s composition remains:
Euro (EUR) — 57.6%
Japanese Yen (JPY) — 13.6%
British Pound (GBP) — 11.9%
Canadian Dollar (CAD) — 9.1%
Swedish Krona (SEK) — 4.2%
Swiss Franc (CHF) — 3.6%
Given the Euro's massive share of the index, you can see why a significant swing in the EUR/USD can significantly influence the DXY. This very interplay is what often leads traders to consider analysing DXY and gold charts in tandem.
The underlying reasoning is straightforward: any appreciation in the dollar tends to increase the cost of dollar-priced commodities for anyone holding foreign currency. That higher cost can reduce demand and contribute to lower prices.
Gold vs USD
The enduring inverse relationship between gold and the U.S. dollar is not accidental; it stems from two key forces working in tandem: their direct pricing mechanics and their competition for the role of 'safe haven'.
The mechanical link is the most straightforward. Since the global price tag for gold is written in U.S. dollars, any shift in the currency's value has a direct impact. A strengthening dollar, for instance, tends to weigh on gold's price simply because fewer dollars are needed to purchase an ounce.
For an investor outside the U.S., that same strong dollar makes the metal more expensive in their local currency, which can reduce buying interest. A falling dollar, of course, tends to have the opposite effect, making gold appear cheaper to international buyers and often fueling demand.
Layered on top of this pricing dynamic is their competition as safe havens. In periods of broad market turmoil, capital tends to seek a sanctuary. Where that money flows, however, often hinges on the specific source of the anxiety. A general flight from risk might see investors move toward the perceived safety of the U.S. dollar and its Treasury bonds.
Yet, when the crisis itself originates from within the United States—be it a contentious debt ceiling showdown or a bout of runaway inflation—investors may bypass the dollar and turn to gold as the time-tested store of value.
The Deciding Factor: U.S. Interest Rates
Nowhere is the relationship between gold and the dollar more pronounced than in the arena of U.S. interest rates. The entire dynamic pivots on one crucial concept: opportunity cost. Gold, for all its historical prestige, is an inert asset; it pays no interest or dividends. U.S. Treasury bonds, on the other hand, offer a yield.
This simple fact creates an incentive structure. When the Federal Reserve raises interest rates, the yield on U.S. bonds climbs, making the choice to own a non-yielding asset like gold less attractive by comparison.
This environment can lead to capital moving away from gold towards better returns elsewhere. The aggressive rate-hiking cycle of 2022 served as a stark, real-world stress test for this very principle. Even as inflation soared—a condition that could have theoretically been a major tailwind for gold—the metal’s price fell sharply under the immense pressure of rising bond yields.
[[aa-fast-fact]]
Fast Fact
Central banks have increased gold purchases. According to data from the World Gold Council, these institutions embarked on a gold-buying spree, acquiring a staggering 1,082 metric tons in 2022, followed by another 1,037 tons in 2023.
[[/a]]
How Oil Prices Drive National Currencies
The correlation between crude oil and the U.S. dollar is indirect, driven by the dollar's role as a pricing mechanism. The oil correlation forex traders watch most closely is far more direct: the link between the price of oil and the currencies of major oil-exporting nations.
The currencies of countries whose economies are heavily dependent on the export of natural resources are known as "commodity currencies." For oil, the most prominent examples are:
Canadian Dollar (CAD)
Norwegian Krone (NOK)
Russian Ruble (RUB)
The economic connection here is simple. When oil prices rise, these nations generate more foreign revenue from their exports. However, there's a catch for buyers: to obtain the oil, they first need to acquire the local currency, whether it's CAD or NOK. All this buying pressure naturally gives the commodity currency a boost.
Case Example: Canadian Dollar
The Canadian Dollar serves as a clear and widely traded example of this dynamic. Canada is a top-five global oil producer. Crude oil is its single largest export, making up a significant part of its GDP.
This simple fact of economics creates a correlation between WTI crude prices and the USD/CAD pair. When oil prices rise, this often leads to an increase in the value of Canadian exports, which bolsters the CAD and tends to cause the USD/CAD rate to decline. A drop in oil prices may prompt the opposite reaction.
This relationship was evident during the oil price crash of 2014-2015. As WTI crude prices fell from over $100 to below $40 a barrel, the Canadian dollar was dragged down in its wake.
The result was clear on the charts: the USD/CAD pair rose from the 1.10 range to over 1.45. It highlighted the Canadian economy's dependence to the energy sector.
The Domino Effect
A decline in a cornerstone commodity like oil is rarely a contained event. More often, it indicates broadening global demand pressure, affecting market beyond the energy.
During that same 2014-2015 downturn, for instance, the weakness wasn't isolated to oil. The pressure extended to other industrial commodities and affected other resource-heavy currencies, notably the Australian Dollar. Such events illustrate the intricate linkages connecting energy, metals, and the forex world.
The Shifting Correlation Between Gold and Oil
The relationship between gold and crude oil is far more complex than the others in this analysis. There is no single, consistent rule.
You might see their prices move together, move in opposite directions, or completely ignore each other. The nature of their correlation depends entirely on the prevailing global economic and geopolitical environment.
The Inflation Connection
There are, however, two specific scenarios that tend to cause gold and oil to show a positive correlation.
The first is during periods of high inflation.
Periods of high inflation may produce a positive correlation between gold and oil. Surging oil prices tend to contribute to inflation. As the value of regular money gets eaten away, investors seek gold as a store of value. In this environment, both asset prices often rise together.
Geopolitical shocks, especially those involving the Middle East, represent another catalyst.
The risk of supply disruptions in these scenarios tend to lead to higher price of oil. At the same time, increased global anxiety supports demand for "safe haven" assets, with gold often benefiting. This dynamic was visible during the initial market reactions to the Gulf War in 1990, for instance.
The Gold-to-Oil Ratio
Professional traders may also consider the Gold-to-Oil ratio. This metric helps analyse the relative value between the two commodities. Calculating the ratio is a matter of simple division: the price of a gold ounce over the price of an oil barrel.
Historically, this ratio has tended to revert to a long-term average of around 15.5. For this reason, any significant deviation from that number may indicate broad market stress or, for the opportunistic, a potential trading setup..
Analysing the effects of gold USD oil price movements with this ratio can provide an additional market context. It is a considered tool for trading correlations in the commodity markets. It helps traders observe when the relative value between gold and oil differs significantly from its historical average.
A Practical Guide to Intermarket Analysis
True intermarket analysis begins when you stop looking at charts in isolation and start cultivating an awareness of the relationships connecting different markets.
A trader who observes the interplay between giants like gold oil USD can gain additional context on the market's overall mood. Often, watching the price action in one of these core assets can provide clues about where another might be heading.
Here’s a simple framework for this approach:
Consider the DXY. Movements in the Dollar Index often relate to commodity price changes. A big move up or down in the dollar may affect gold and oil prices.
Observe the Oil Market for context on commodity currencies. A clear trend in crude oil may influence views on commodity currencies. For instance, changes in oil may affect movements of the USD/CAD pair.
Monitor Gold for broader data. Gold often reflects market’s uncertainty. A sudden rally in the metal can be a sign of a broader shift of market sentiment that tends to affect assets like stock indices.
Conclusion
It is crucial to treat these relationships as fluid tendencies rather than as rigid, unbreakable laws. They can, and often do, decouple, particularly during moments of extreme market stress or when significant global developments emerge.
Ultimately, the purpose of this deeper analysis isn't to uncover some secret, unchanging formula for trading the markets—such a thing doesn't exist.
The real value is the development of a richer, contextual view that allows you to understand the "why" behind a price movement, not just the "what." It is this contextual awareness, more than anything else, that separates a reactive market participant from a proactive analyst.
[[aa-faq]]
FAQ
What does DXY correlate with?
Mainly, it has typically shown a strong inverse relationship with gold. Movements in the DXY often relate to movements in gold prices. Its link to oil and oil-currencies like the Canadian dollar is more complicated and can change.
What happens when the U.S. dollar is high?
In simple terms, it's showing strength against other currencies. For anything priced in dollars, like gold and oil, a strong dollar tends to make the sticker price in USD appear lower. This may affect their price for buyers using other currencies.
What is the most reliable correlation of the three?
The gold vs USD relationship which is closely monitored relationship in the financial world.
Why should I care about these correlations?
Because they provide context. A big move in the dollar often occurs alongside developments in gold or oil
[[/a]]
[[aa-cta]]
Trading carry high risk of capital loss and is not suitable for everyone. Past performance does not predict future results.
[[/a]]
Connect with Our Experts
Our team is equipped to provide solutions precisely to your requirements. Let's explore your options and discuss how we can support your objectives


.svg)