Oops! Something went wrong while submitting the form.
Notice: It looks like you are visiting us from United Arab Emirates or have selected it as your residency location.
For accurate information and services under the correct licensed entity, please visit the appropriate section of our website. For more information view Regulatory Information
For accurate information and services under the correct licensed entity, please visit the appropriate section of our website. For more information view Regulatory Information
Markets sometimes move sharply following periods of stability. These moments, known as breakouts, can signal potential new trend. Understanding how to approach breakout strategies is one of several techniques traders may use.
In this guide, we'll explain the breakout trading strategy, how traders may identify potential setups, and common mistakes to be aware of.
[[aa-key-takeaways]]
Key Takeaways
Breakouts mark can indicate the start of a newmarket trends and often occur after periods of consolidation or low volatility.
Volume is often considered an important factor, a breakout may be weak or false. The traders typically look for confirmation before entering the position.
Planning exits is just as crucial as timing entries. Clear profit targets and stop-losses help protect gains and limit losses.
[[/a]]
What Is a Breakout in Trading?
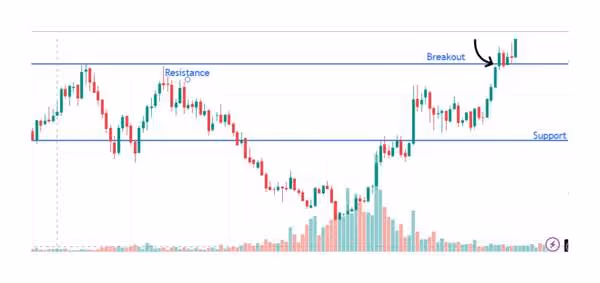
When an asset price crosses beyond a well-defined support or resistance level with noticeable momentum, it can be described as a breakout in the market. These price levels can be likened to invisible walls in a market; prices would bounce against them, but when there's a breakout, prices wouldl pierce through these levels, sometimes leading to sharp movements, although false signals are common.
There are various types of breakouts. However, the one core thing they all revolve around is that the market has been coiling, consolidating, or moving sideways, which can sometimes precede a significant move.
For example, suppose a currency pair has been trading between £1.20 and £1.25 for weeks. A break above the high of £1.25 may indicate a possible shift in market sentiment, particularly if accompanied by strong trading volume, though this may not be always the case.
However, not every breakout is of equal significance. Some breakouts appear more reliable and are supportedby volume and follow-through momentum. And some often called fake breakouts occur when the price temporarily crosses that particular level of interest for a short while before reversing
Breaking before confirming that a price has closed beyond the breakout point or that there is some volume behind it can be a risky venture, which is why breakout traders look for the confirmation before entering the market.
[[aa-fast-fact]]
Fast Fact
The opening range breakout (ORB) strategy, employed during the first hour of market open, is one of the long-established method for analysing intraday momentum, though its effectiveness varies.
[[/a]]
Breakout Variations in Trading
Some traders use to respond to early price movements of a market, by breakout trading technique.
When a price moves outside a clearly defined support or resistance, sometimes accompanied by increased volume and momentum, we refer to it as a breakout. In such a moment, traders may interpret the price action as a possible change in a new direction.
Thus, if a trader is interested in breakout-based strategies, it may be useful to understand the various types of breakout patterns that may occur in the market.
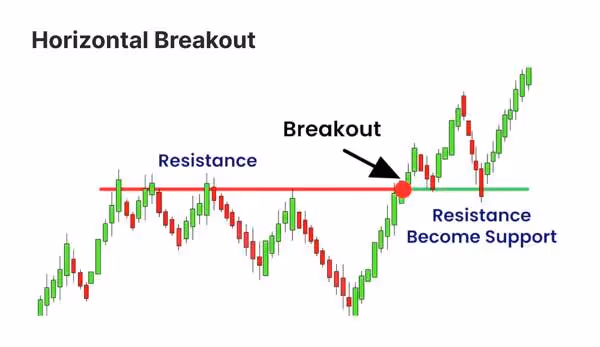
Horizontal Breakouts
A common structure in a breakout is the price moving through horizontal support and resistance levels. The support and resistance levels are areas where the price has historically turned around or stalled, which some traders use as potential entry or exit levels.
If the stock price moves above a resistance level — or below support — along with additional signals such as rising volume or closing candles, then this can be interpreted as a potentialbreakout.
For instance, a move above a narrow range is sometimes seen as a potential breakout point and/or a point where the price may continue to move.
Chart Pattern Breakouts
Many breakout traders monitor chart breakout patterns when analysing potential market movements. The price action patterns may indicate change in market sentiment, which on occasion may be followed by a breakout that follows the prevailing trend. Triangles, rectangles, and flags are among common observed formations.
When a price forms a symmetrical triangle that then breaks out, some traders interpret this as the potential breakout direction. Before major market movements, these patterns frequently emerge, and technical analysts examine them meticulously.
The exclusive reliance on historical performance presents significant risk factors; investors therefore also look for additional breakout indicators, such as volume and momentum to support their analysis, though these do not guarantee accuracy.
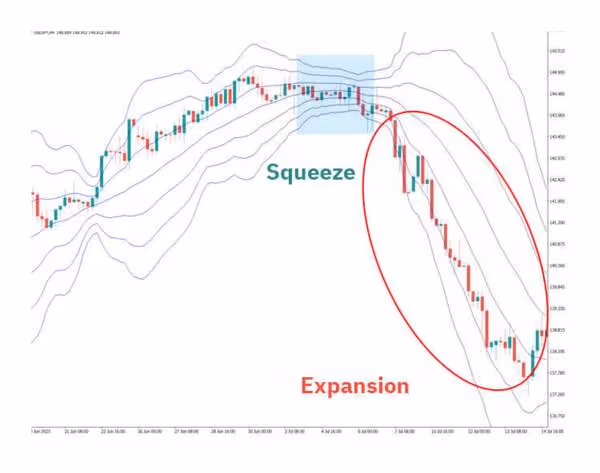
Volatility-Based Breakouts
Trading using breakouts strategies is often associated with market periods showing decreased volatility. The constricting price chart can sometimes indicate potential strong market movement.
Forex actual breakout strategies are sometimes applied during periods of consolidation that may occur before the major news events or economic shifts.
When momentum increases, the prices can move beyond narrow ranges, the market can create trading opportunities. Traders sometimes use tools such as Bollinger Bands and ATR to assess potential market conditions and volatility, offering additional instruments for analysis of changing financial markets.
News-Driven Breakouts
Major news events can sometimes trigger immediate market breakouts that do not follow traditional chart patterns. Earnings reports, along with geopolitical events and policy changes, are examples of factors that may cause stock prices to fluctuate rapidly.
The opportunity to conduct a thorough market analysis is minimal in these situations. Some experienced traders who implement structured trading strategies alongside robust risk management plans may attempt to find opportunities in breakout levels by applying appropriate exit strategies.
This trading style may involve the potential for opportunities, yet demands rapid decision-making combined with financial self-awareness to minimize the possibility of losses.
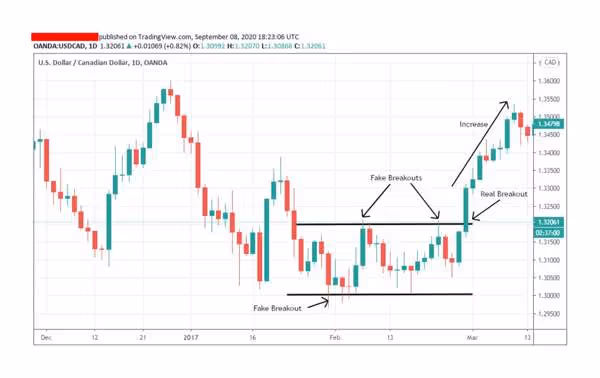
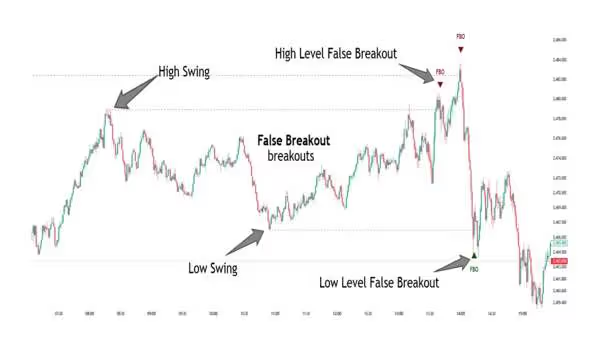
False Breakouts and Failed Setups
Not every breakout results in lasting profits. False breakouts occur when the price moves beyond support or resistance zone, but reverses quickly and does not stay above or below it failing to sustain momentum. False breakouts can be challenging to deal with, especially when trading breakouts with tight stops or no clear exit points.
Some traders attempt to reduce risk by waiting for market close confirmation, or to only trade breakouts when the signals resume their rules and appear to be in a line with reasonable risk criteria.
Failed breakouts are common in trading, and, more importantly, you want to reduce their impact by applying risk management, however this approach does not guarantee profits.
Important Parts of a Breakout Trading Plan
A breakout trade plan usually involves more than just entering the market when prices move beyond a certain level. To better understand how such strategies are approached, it is useful to consider the main factors and elements that traders take into account. Here are the important things the breakout buyers typically monitor.
Spot Calm Areas
Before a breakout, sometimes markets show a quiet period when the prices remain within a narrow range.
During these times, the price may change slightly, with neither buyers nor sellers in control. Such conditions may occasionally precede a significant change and larger market moves.
To observe these areas, traders may use tools such as Bollinger Bands, which narrow when activity decreases, or Average True Range (ATR), which indicates the market's level of volatility. A low ATR can indicate reduced market activity, which some traders may interpret as a possible time for a market ready for a breakout.
Check the Volume
Volume is often considered an important factor assessing the strength of a price move. A breakout without a large increase in volume may be likely to reverse or fail, white higher volume can suggest interest and stronger market participation. .
To analyse volume strength, traders sometimes use volume bars or tools like On-Balance Volume (OBV) and the Volume Oscillator. These indicators can help to understand if the market appears to support the breakout.
When to Buy
Deciding when to enter the market is often discussed. Traders debate whether to choose the enter immediately when the breakout occurs or wait for confirmation such as waiting for the candle to close beyond the breakout level. This may reduce the likelihood of acting on false signal
The approach can vary based on your trading style. Day traders often monitor for breakout trades shorter periods, such as 5 or 15 minutes charts, primarily in fast-moving markets. Swing traders, though, might look at longer timeframes, for example daily or 4-hour charts..
Place Stop-Losses
Risk management is an important part in any trading strategy and many breakout traders use stop-loss orders as part of their structure, aiming to limit potential losses if the breakout fails.
Some traders set stop-loss based on market activity using tools like the ATR. This can help create a line around the breakout point. These approaches are common and may be helpful in markets that tend to move quickly near key points
Profit Targets and Exit Plans
Setting exit levels are often considered just as important as setting entry levels. One common method is to measure the size of the consolidation area and project it from the breakout point—this relies on past price action and is not always reliable.
How you exit a trade can vary. Some traders reduce their position gradually, as prices move in their favour. Others use a trailing stop, to attempt to capture trends. Each approach carries different risks and outcomes, and the strategy may depend on your style, targets, and overall trade plan.
Key Breakout Forms to Track
In breakout strategies, some chart patterns are often monitored by traders as part of their analysis. These formations emerge over the time from the interactions between buyers and sellers and may occasionally precede strong market moves.
These forms below are commonly mentioned by breakout traders, as they use them to identify potential breakout..
Up and Down Triangles
The upward triangle is a chart pattern that typically forms when the market makes higher lows each time but fails to break horizontal resistance level. It shapes a triangle with a flat top and a rising base. Some traders interpret this pattern as a potential bullish signal, however false breakouts are possible due to uncertainty.
On the other side, the downward triangle forms when the market makes lower highs while holding a flat support level . It has a flat base and traders may view this as a potential bearish signal, but it does not always result in downward movement.
These shapes are among the patterns that traders planning for breakout trading monitor, often alongside other factors such as volume and momentum.
Square Range
The square - or boxed - pattern forms when the price moves between horizontal support and resistance levels. Here, the price shifts between support and resistance level, making a flat box. At this point there is no clear market direction, with buyers and sellers in relative balance.
When the price eventually moves beyond this range and levels, some traders may interpret it as a potential breakout sign. These square range formations are monitored by traders since they provide identifiable levels of support and resistance, though outcomes vary..
Cup and Handle
The cup and handle is a continuation pattern. It resembles a teacup, where the price first dips and then slowly rises, creating a smooth base. After this bounce, the price may dips a bit to form the "handle"—a small rest before the subsequent rise.
The traders sometimes interpret the price moves above the top of the cup, often accompanied by increased volume as a potential breakout signal. This form may indicate potential continuation, where traders monitor volume and momentum for confirmation. It's liked by swing traders however its reliability depends on broader market conditions.
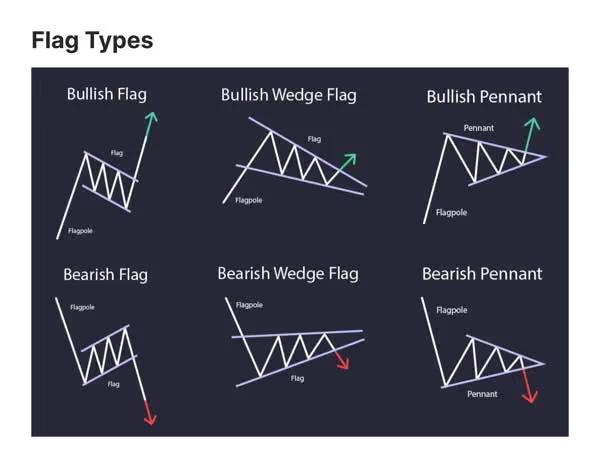
Bull Flags and Bear Flags
Flags are chart formations that sometimes appear after a sharp price move—up or down. A bull flag forms when the price rises high, then rests in a small, downward-sloping space. This break in the trend should be short, and if the price moves above this range, the traders may interpret it as a potential continuation signal.
A bear flag, in comparison, usually forms after a sharp fall. The price should then recede slightly in an upward tilt lane. A break below this range is sometimes viewed as a sign of possible further price drop.
These formations are monitored by traders for their clean build and short rest time, but they do not always lead to reliable outcomes
First Hour Breakouts (ORB)
The First Hour Breakout is a strategy followed by some day traders, particularly in stock and Forex breakout plans. It eyes the high and low made in the first 15 to 60 minutes after the market opens. These early levels are sometimes monitored as short-term support and resistance zones.
When price moves strongly beyond these levels within the first hour—it can be interpreted as a signal of momentum for the entire meeting. Many traders observe ORBs to identify early breakout hints, often combining them with other tools or news alerts for added confirmation.
Common Mistakes and How to Dodge Them
Even with a well-prepared breakout trade plan, challenges are common, mostly in fast-moving markets. Many new traders encounter similar errors. Let's examine the most common mistakes in breakout trades, along with considerations on how traders may manage these risks.
Jumping into Breakouts Too Late
A common challenge made by new traders is entering the market after the move has already begun. The price breaks, and this can be influenced by the fear of missing out (FOMO). This may result in entering at less favourable prices
To avoid this, traders try to identify breakout areas in advance and preparing trading plan for how they will act if the breakout occurs. Others prefer to avoid trading if the move appears to progress too far.
Not Watching Volume
Volume is often considered an important factor in evaluating breakouts. A breakout with weak volume behind it may be less sustainable or reverse. However, many traders overlook this vital point by focusing solely on the price.
Some traders look for significant increase in volume, to help support their strategy. Some traders use tools like volume bars, OBV, or volume profiles to see if the breakout has strong support.
Trading in Slow Times
Market conditions change through the day. During the quiet period—like lunch in New York or early in Asia—price movements may appear to break out but often lack follow-through without enough movement.
Some traders therefore prefer to monitor and enter the market during more active sessions. In Forex, the London–New York time zone is known for high volume and volatility. In the stock market, the start and end of the trading day are typically the most volatile times.
Not Planning Exits
A common challenge in breakout trading is initiating a trade without a clear exit plan. Many traders may become so focused on the breakout itself that they overlook to manage the positions and plan their exits. Without exit and stop-loss levels, trades can be exposed more to chance outcomes
To address this some traders define their profit goal and a clear stop-loss in advance. Whether you use measured moves, Fibonacci levels, or trailing stops, having an exit plan gives you more clarity and control over your trading strategy.
Conclusion
Breakout trading involves more than just chasing price. It requiresplanning, timing, and reading the market conditions before making decisions. By learning to monitor breakout patterns, volume as confirmation, and managing the trades with clear exits and stops, many traders develop a strategy based in discipline rather than guesswork.
Like all trading approaches, it takes practice - but carries also risk Breakout trading may sometimes allow traders early in potential trends.
[[aa-faq]]
FAQ
Can breakout trading be applied to Forex and cryptocurrency?
Yes. Breakout strategies are followed in the Forex, crypto, and stock markets.
How do I know if a breakout is real?
Some traders look for confirmation through substantial volume and a full candle close beyond the key levels.
What is the best timeframe for breakout trading?
There is no single best timeframe. Intraday traders may monitor shorter 5–15 min charts, while swing traders sometimes prefer 4-hour or daily charts.
[[/a]]
Connect with Our Experts
Our team is equipped to provide solutions precisely to your requirements. Let's explore your options and discuss how we can support your objectives


.svg)