Oops! Something went wrong while submitting the form.
Notice: It looks like you are visiting us from United Arab Emirates or have selected it as your residency location.
For accurate information and services under the correct licensed entity, please visit the appropriate section of our website. For more information view Regulatory Information
For accurate information and services under the correct licensed entity, please visit the appropriate section of our website. For more information view Regulatory Information
El enfoque del trader a la acción del precio y las estrategias de trading ICT
En este artículo
Aleksander Shishkanov
Alexander Shishkanov tiene varios años de experiencia en la industria de las criptomonedas y la tecnología financiera y le apasiona explorar la tecnología blockchain.
Price action trading is the practice of making trading decisions based solely on raw price data (candlestick behavior, swing highs and lows, and support and resistance zones) without relying on lagging indicators. As a skill, it rewards disciplined chart reading over mechanical signal-following, making it one of the most adaptable approaches available to traders working across Forex, crypto, and CFDs.
Most traders arrive here after the same experience: a chart full of indicators, an entry that always seems a bar too late, or a stop-out that looks, in hindsight, like a deliberate liquidity sweep. This guide provides a framework for reading what price is doing right now. It defines price action, see how it compares to indicator-heavy setups, and learn the core ICT concepts (order blocks, fair value gaps, liquidity sweeps) that help explain institutional behavior on the chart. Then it works through a multi-time-frame checklist, a table of common mistakes, and a clear path to executing these setups across B2PRIME's unified trading account.
[[aa-key-takeaways]]
Key Takeaways
Price action trading reads raw price movements—candlestick patterns, support/resistance levels, and market structure—without relying on lagging indicators, which may give faster signals directly from the chart.
ICT (Inner Circle Trader) concepts such as order blocks, fair value gaps, and liquidity sweeps layer institutional logic onto traditional price action, which may help traders anticipate where larger participants may enter or exit.
Multi-time-frame alignment may help: identify directional bias on higher time frames, then sync entries on lower time frames to filter low-probability setups.
Academic research suggests that skilled price action analysis may improve the results of some systematic strategies - trader skill and pattern recognition matter.
B2PRIME's ~7-millisecond execution and TradingView integration allow traders to act on price action signals the moment they form, across Forex, Crypto Spot, Crypto Perpetual Futures, and CFDs from a single account.
[[/a]]
What is Price Action
Price action trading uses three primary inputs to build a trading decision: how individual candles behave (their bodies, wicks, and closes), where swing highs and lows form in sequence, and which horizontal zones have repeatedly attracted buying or selling pressure.
Contrast this with indicator-led approaches. A moving average, RSI, or MACD is calculated from past price data; it reflects what happened several bars ago. Price action focuses on what the market is doing now: is this candle closing above a key zone or rejecting it? Is this swing high getting taken out or holding?
The practical benefit is timing. When price tests a significant support level, a candle closing back above it may be a signal. The equivalent indicator reading lags by its input period, often long enough that the entry price may have moved against the trader.
Price action concepts work across any liquid market. The same structural analysis applied to EUR/USD applies to Bitcoin on a 4-hour chart or Brent crude on a daily chart. The instruments differ; the logic does not. A 2024 academic study suggested that skilled discretionary price action reading may improve trading outcomes.
Price Action vs. Indicator Stacks
The choice between a clean chart and an indicator stack comes down to what you need the chart to answer.
Signal timing. Indicators delay because they are averages of past price. Price action reacts at the candle close, as fast as the chart updates.
Chart clarity. A chart with five overlays and three sub-panels competes for your attention at the worst moment, which is when price is moving fast. A price action chart with marked levels focuses attention on one key question: is price accepting above or below this zone?
Adaptability to volatility. Indicators calibrated for normal conditions give false signals in trending or volatile conditions. Price action adjusts automatically: market structure changes, and levels are re-drawn.
Execution speed. Clean charts directly connected to execution via TradingView integration with B2PRIME's Pro account reduce the decision-to-fill chain. There is no waiting for a cross, a color change, or a threshold breach.
This is not a dismissal of indicators. A single, well-chosen overlay (a 50-period moving average as a trend filter, or a volume profile to confirm value areas) can complement traders’ price action read without cluttering it. One approach is for traders to develop structure and pattern reading first. One indicator may be added only if it meaningfully may improve confidence on specific setups.
Why Market Structure Matters
Market structure is the sequence of swing highs and lows that may indicate who is in control of the market. An uptrend produces higher highs and higher lows. A downtrend produces lower highs and lower lows. A ranging market produces equal highs and lows at the same approximate level.
Structure matters because it provides context for every pattern or level trader identify. A bearish reversal signal at the top of an established uptrend means something different than the same signal in a downtrend: in the first case the trade is against momentum; in the second the trade adds to it.
Two structural signals deserve specific attention:
Break of structure (BOS). A BOS occurs when price takes out the most recent significant high or low in the direction of the trend, which may suggest continuation.
Change of character (CHoCH). A CHoCH occurs when the first counter-trend high or low is broken, suggesting a potential shift in direction rather than a pullback.
A simple structure checklist before placing any trade:
Identify the current sequence: higher highs and higher lows (uptrend), lower highs and lower lows (downtrend), or sideways.
Mark the most recent significant swing points.
Determine whether the last move was a BOS (which may suggest trend continuation) or a CHoCH (which could suggest a reversal).
Structure is often treated as an important context layer for level and pattern analysis.
ICT Concepts Inside Price Action
ICT (Inner Circle Trader) methodology sits within price action as an institutional lens, not a separate system. Where traditional price action asks "what is price doing?" ICT asks "why is price doing it?" The answer, in the ICT framework, often involves institutional order flow.
Order blocks. These are the last one or two candles before a significant move, interpreted as zones where institutional orders were placed. When price returns to an order block, the logic is that the same institutional interest may reactivate.
Fair value gaps (FVG). An FVG is a three-candle imbalance: the wicks of the first and third candles do not overlap, leaving a "gap" in price delivery. Markets often revisit these zones to fill orders that could not be executed on the initial move.
Liquidity pools. These are clusters of stop-loss orders sitting just beyond obvious swing highs and lows, a concept explored in depth in smart money concepts, equal highs or lows, or round numbers. A move into a liquidity pool (briefly pushing beyond the obvious level and then reversing) may explain many “false breakouts”.
Together, these three concepts may help interpret previously puzzling price moves (the stop-out, the wick, the sudden reversal) into predictable behaviors rooted in institutional mechanics.
[[aa-cta]]
Risk disclaimer: The ICT concepts described above are provided for educational purposes only and do not constitute investment advice. Trading any financial instrument carries significant risk and results depend on individual skill, market conditions, and disciplined risk management.
[[/a]]
Spotting Key Levels on Any Chart
Key levels are zones where the market has previously accepted or rejected price, and may do so again. Understanding support and resistance levels is the foundation for identifying these zones accurately. Identifying them is a three-step process.
Step 1: Mark recent swing highs and lows. Start with the highest and lowest points visible on your current chart view. These anchor your structure.
Step 2: Find repeated reversal areas. Look for zones where price has reversed at least twice. Two touches make it a zone; three or more make it significant.
Step 3: Note round numbers and session highs/lows. Major FX pairs and crypto assets react at round numbers ($50,000 BTC, 1.0900 EUR/USD) and at the high and low of the previous session. These may attract institutional interest.
One important calibration: levels are zones, not precise lines. A support zone at 1.0850 on EUR/USD may hold a wick to 1.0840 and still function as support. Wicks and minor breaches are normal; what matters is candle closes beyond a zone, not intrabar moves.
TradingView's drawing tools (rectangle, trend line, horizontal ray) make this process faster. Blocking out zones rather than drawing exact lines reflects how the market actually behaves.
Levels mark areas of higher probability, not guaranteed outcomes. Risk controls (position size, stop placement, invalidation rules) must accompany every level-based decision.
Three High-probability Patterns
The following three patterns appear across Forex, crypto, and CFD markets when traded within a defined market structure. Each carries meaningful failure modes, which is why pattern recognition and risk management must develop together. None of these setups guarantee profitable outcomes; they may indicate areas of elevated probability within the structure you have already defined.
Breakout Continuation
A breakout continuation occurs when price consolidates near a key level and then closes decisively beyond it in the direction of the prevailing trend.
Setup criteria:
An established trend is in place (confirmed by market structure).
Price consolidates at or near a key support or resistance zone.
A candle closes convincingly beyond the zone, not just a wick.
Failure mode: False breakouts are common, particularly when retail stop clusters accumulate just beyond a level. Reduce risk by waiting for a retest of the broken level as new support or resistance, or by requiring two consecutive closes beyond the zone before entering.
Rejection Reversal
A rejection reversal occurs when price approaches a significant level, shows visible rejection in the form of a long wick or engulfing candle, and then closes back in the opposite direction.
Setup criteria:
Price approaches a meaningful support or resistance zone.
A rejection candle forms: a pin bar with a long wick, or a bearish/bullish engulfing pattern.
A follow-through candle may confirm the reversal direction.
In the ICT context, rejection reversals often align with order blocks. The wick represents a brief run into liquidity just beyond the zone before institutional orders absorb the move and reverse it.
Liquidity Grab
A liquidity grab is a brief push beyond an obvious high or low that triggers retail stop-loss orders, followed by a sharp reversal back into range or in the new directional bias.
Identification steps:
Locate obvious swing highs/lows or equal highs/lows where stops are likely concentrated.
Watch for a quick spike beyond the level, usually accompanied by a long wick on the violating candle.
Look for immediate reversal confirmation: a strong close back inside range, or a BOS/CHoCH on the lower time frame.
Liquidity grabs may explain some 'stop-hunt' experiences when properly confirmed.
Multi-time-frame Alignment Steps
Price action read on a single time frame is incomplete. The same level that looks like strong resistance on a 15-minute chart may sit in the middle of a larger daily support zone. Multi-time-frame alignment, matching your higher-time-frame directional bias with lower-time-frame entry precision, separates high-probability setups from noise.
The core rule: the higher time frame defines your directional bias; the lower time frame refines your entry timing and risk placement.
Step 1: Identify Higher-time-frame Bias
Start with the daily or 4-hour chart. Run through this process:
Read the structure: is price making higher highs and higher lows, lower highs and lower lows, or ranging?
Mark the major levels: swing highs and lows from the past several weeks.
If you use ICT concepts, note the prominent order blocks and fair value gaps on this time frame.
If higher-time-frame structure is bearish, taking long setups on a 5-minute chart means trading against the dominant flow. It is possible to win individual trades against the trend; it is harder to win consistently.
Step 2: Sync Entry Chart
Drop to your entry time frame (typically 1-hour or 15-minute for swing and intraday traders).
The sync checklist:
Confirm that lower-time-frame structure aligns with the higher-time-frame direction (e.g., BOS to the downside on the 15-minute, while the daily is in a downtrend).
Select the appropriate entry pattern: breakout continuation, rejection reversal, or liquidity grab.
Predefine your entry, stop-loss, and initial target before the candle completes.
TradingView's multi-chart layouts allow you to view both time frames simultaneously without toggling. B2PRIME's TradingView integration means your entry is one click from analysis to execution.
Step 3: Confirm with price closes
The most common source of false entries is acting on an intrabar wick rather than waiting for a candle close.
Confirmation checklist:
The candle body closes beyond the level, body only, not just a wick.
No immediate rejection wick negates the close (e.g., a candle that closes above resistance but shows a long upper wick reclaiming the level).
The next candle follows through with at least a partial move in the expected direction.
Patience is the defining discipline of price action trading. Waiting for a confirmed close costs you some potential reward on the initial move but may reduce false entries. Over time, the arithmetic of fewer bad trades outweighs the occasional earlier entry you miss.
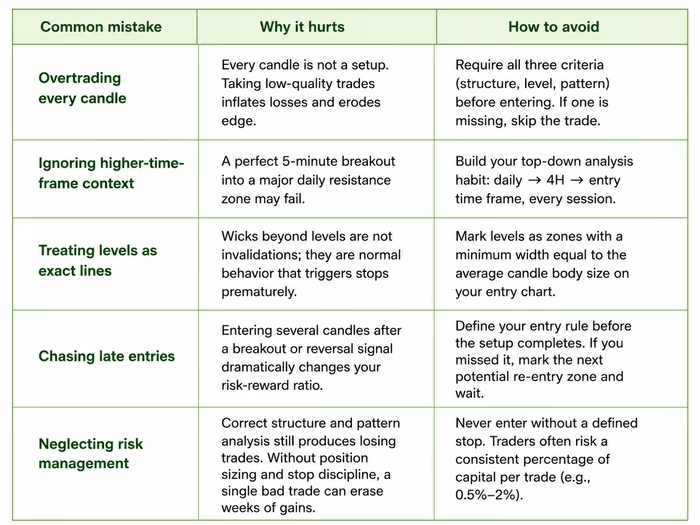
Common Pitfalls for the Price Action Trader
The following mistakes are common at every stage of development. They are predictable patterns that appear when practice, journaling, and structural discipline are not yet consistent.
Journaling may support improvement over time. Log every setup: the structure reading, the pattern, the entry rationale, and the outcome. Repeated review reveals which setups you execute with consistent skill and which you consistently misread. A structured trading plan gives your journal a framework to measure against.
Executing Price Action Across Crypto, FX, and CFDs
The same chart-reading process can be applied across markets. A rejection reversal at a key order block functions similarly on EUR/USD, BTC/USD, and a Brent crude CFD. The institutional mechanics that create those levels may be similar across underlying assets.
Applying this consistently across asset classes requires an execution environment that matches the method:
Fast execution. Price action setups form and resolve in seconds. A fill delay of 30ms or more on a fast reversal can mean entering at the wrong side of a wick.
TradingView chart-to-trade workflow. Drawing a level, identifying a pattern, and executing without platform switching is standard on B2PRIME's account through TradingView direct integration.
Single cross-collateral account. B2PRIME's unified account covers Crypto Spot, Crypto Perpetual Futures, and CFDs under a single margin pool. You can run the same price action workflow across all three without moving funds between accounts.
[[aa-cta]]
Risk disclaimer: CFD trading involves significant risk of loss and is not appropriate for all investors. Losses can exceed your initial deposit. Ensure you fully understand the risks involved and seek independent financial advice if necessary.
[[/a]]
[[aa-cta]]
For crypto products: crypto spot and perpetual futures are available to eligible clients under applicable regulatory frameworks, including the Bahamian DARE regime, where permitted and subject to jurisdiction restrictions and applicable leverage limits per entity.
[[/a]]
Engage in Price Action Trading on a Unified Trading Account
Price action trading at its core is a skill: the ability to read what the market is communicating through its structure, its levels, and the behavior of individual candles, then execute decisively when those elements align.
The practical next steps for putting this framework into consistent practice:
Open a B2PRIME account to access TradingView charting with direct execution, giving you the clean chart environment and fast fills that price action demands.
Start on higher time frames. Daily and 4-hour charts move more cleanly than 5-minute charts and let you build your structure-reading skill before you work on entry precision.
Journal every setup. Record what you saw, why you entered, and what actually happened. Within 30 to 50 trades, patterns in your own execution will be visible.
B2PRIME provides institutional-grade infrastructure to retail and professional traders: regulated accounts across multiple jurisdictions, a unified cross-collateral account for Forex, crypto, and CFDs, and a TradingView integration purpose-built for the chart-first workflow that price action trading demands.
CFDs are complex instruments and come with a high risk of losing money rapidly due to leverage. You should consider whether you understand how CFDs work and whether you can afford to take the high risk of losing your money.
[[aa-faq]]
FAQ
Does Price Action Work on Crypto Spot and Futures?
Yes. Price action principles apply to any liquid market, including crypto spot and crypto perpetual futures. The same level, structure, and candlestick-reading process works across both. Crypto markets may produce clearer ICT patterns for some traders, particularly liquidity grabs and order block reactions, due to their high retail participation and transparent on-chain structure.
Which Chart Time Frame is Best for Day Trading with price Action?
Most day traders use 15-minute or 5-minute charts for entries while referencing the 1-hour or 4-hour chart for directional bias. The most effective time frame depends on your schedule and preferred trade frequency. Starting with 15-minute entries and adjusting based on your journaled results is a practical approach.
Can I Combine Price Action With a Single Indicator?
Yes. Many traders add one indicator (such as a moving average or volume profile) to support price action decisions without cluttering the chart. The indicator should confirm what price is already doing, not replace your reading of structure and levels. If you find yourself waiting for the indicator over your structure read, it has too much weight in your decision process.
Is Price Action a Good Strategy?
Research suggests that skilled price action analysis may improve trading outcomes. A 2024 study (Zarattini & Stamatoudis, SSRN) found that discretionary technical trading decisions by skilled practitioners found that discretionary decisions by skilled practitioners may improve the results of some systematic strategies. Results depend on consistent practice, journaling, and disciplined risk management. No strategy guarantees profits, and all trading carries risk of loss.
What is Price Action in Day Trading?
Price action in day trading means using intraday candlesticks, support and resistance, and market structure to make decisions without relying primarily on lagging indicators. Most day traders focus on lower time frames (roughly 5-minute to 1-hour) while checking higher-time-frame context to confirm directional bias before entering.
[[/a]]
Conecta con Nuestros Expertos
Nuestro equipo está preparado para ofrecer soluciones ajustadas exactamente a tus necesidades. Exploremos tus opciones y hablemos sobre cómo podemos apoyar tus objetivos


.svg)