Oops! Something went wrong while submitting the form.
Notice: It looks like you are visiting us from United Arab Emirates or have selected it as your residency location.
For accurate information and services under the correct licensed entity, please visit the appropriate section of our website. For more information view Regulatory Information
For accurate information and services under the correct licensed entity, please visit the appropriate section of our website. For more information view Regulatory Information
Seasoned traders watch quotes carefully, some of them every single day, and often they start by looking at two numbers, sitting side by side. The bid vs ask quote is the first thing that may tell you who’s willing to buy, who’s willing to sell, and how confident the market feels at that moment.
The difference between bid and ask is small on the screen, but it’s one of the biggest drivers of trading costs. FX desks know this. Anyone trading CFDs or crypto feels it the second they open a position and notice they’re already a shade in the red. That tiny gap is the toll you pay for participating in the market instead of waiting. Depending on the instrument, that toll can be barely noticeable or annoyingly wide.
Market watchers at the New York Fed track this spread as a sign of liquidity in U.S. Treasuries, they wrote about it in their Liberty Street Economics blog when spreads ballooned during the 2020 shock and again in the 2023 banking mess. It’s the same story in European bonds. Regulators watch the spread because it may shows how healthy (or strained) a market is.
For traders on B2PRIME’s feed, that quote comes from a mix of venues and liquidity sources. Tight spreads and deep books may help, but understanding why those two prices matter is what really changes how you trade.
What is Bid and Ask Price in Trading?
If you strip a market down to its simplest moving parts, you’re left with two prices. One shows what buyers are willing to pay. The other shows what sellers are willing to take. That’s the bid price vs ask price, and everything else builds on top of it.
The bid is the highest price any buyer is quoting right now. The ask, sometimes called the offer, is the lowest price a seller is quoting at the same moment. Two sides showing competing intentions. These aren’t theoretical values; they move with every change in supply and demand. When liquidity is strong, both sides refresh constantly. When depth is thin, the screen may feel jumpy and spreads can widen without warning.
These quotes don’t tell you a “true” price. Markets don’t have an official number like that. What you’re seeing is where buyers and sellers are willing to meet right now, which can shift in a heartbeat after a data release or a block trade hitting the tape. That’s why liquidity providers feed aggregated prices instead of relying on a single venue. B2PRIME applies a similar aggregation approach, pooling sources can help smooth the edges and generally contributes to tighter pricing, though results may vary depending on the market conditions.
How Bid Size vs Ask Size Appear on Trading Platforms
Most platforms show a simple two-number quote, something like EUR/USD 1.08495 / 1.08505. The left side is the bid, the right side is the ask. That’s Level I data, just the best prices. Level II (or depth of market) goes further, stacking multiple bid and ask levels with their volumes. On setups connected to B2PRIME, that screen usually includes the symbol, the bid price vs ask price, the spread, and sometimes the sizes resting at the top level. It’s basic at a glance, but it’s the heartbeat of every market.
Bid vs Ask Price and the Bid-Ask Spread
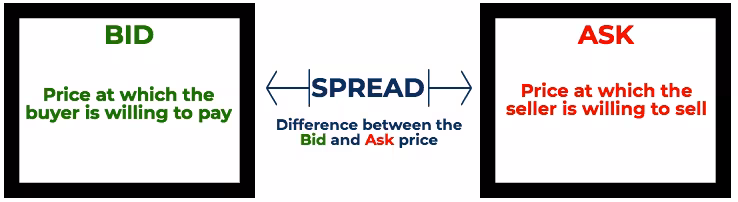
The bid versus ask relationship is simple on paper:
The bid is the most any buyer will pay,
The ask is the least any seller will take.
The gap between the two is the spread. That’s your cost to get in or out on the spot.
A tight spread usually means buyers and sellers are comfortable showing size. High liquidity could signal plenty of competition. When that gap widens, the screen starts telling a different story. Maybe volume dried up, or volatility jumped.
Look at Treasuries during rough periods: spreads ballooned during the 2020 shock and again in the 2023 banking flare-up. They tightened again once conditions calmed, a decent reminder that spreads can react to stress faster than most indicators traders like to quote.
An Example of Bid Ask and Spread
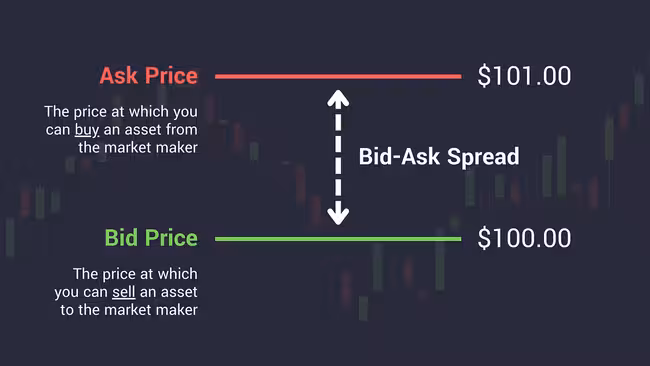
A simple bid-ask price example can make the point clearer. Let’s say buyers are lined up around 1.1000 while the best-selling price is 1.1002. If your average target on a scalp is five pips, two are already gone before you even start working for the remaining three. That’s why short-term traders obsess over spreads and execution quality.
ETF desks think about this often the same way. Most consider the bid and ask rate as part of the actual cost of holding or trading an ETF. It’s not just commissions; it’s the price you pay to get into and out of the fund.
Institutional traders rely on deep liquidity to keep this cost predictable. Aggregated pricing, such as that offered by B2PRIME, aims to provide access to deeper market liquidity. When multiple venues feed the book, it tends to help spreads stay steadier, and slippage to bite less often. However, trading conditions and results depend on market factors and execution arrangements.
Ask Price vs Bid Price in Different Markets
Every market has its own personality, and you can feel it most clearly in the bid vs ask price. The mechanics stay the same (there’s always a buyer and a seller) but the way the bid and ask rate behaves across asset classes can be wildly different. Once you’ve traded a mix of products, this becomes obvious pretty fast.
What is Bid and Ask in Stocks and ETFs?
Big equity names are usually well-behaved. Anyone who’s spent time watching Level II on a liquid stock could notice that the book may stay fairly full, and the top-of-book spread can barely move unless something meaningful hits the tape. That can be the typical bid and ask stock experience, simple, visible, and stable.
ETFs are similar on the surface but have an extra layer underneath. You’re not just paying the spread on the screen; the underlying basket plays a role. The spread is part of the actual cost of trading the fund. Some ETFs barely move a cent wide. Others, especially the niche ones, can get sloppy around rebalance dates or quiet sessions.
Bid vs Ask in Forex and CFDs
FX is its own world. Two-way quotes are the whole point of the market. You may see spreads on EUR/USD tighten to almost nothing during the London–New York overlap, then they could drift a bit once the U.S. afternoon fades. Some brokers pad spreads; others pass them through.
Liquidity providers compete hard on this because a clean quote is basically the product. CFDs mirror the underlying market, but the markup and liquidity source often shape the final feel.
Bid vs Ask Price in Futures and Options
Futures can be tight or chaotic depending on the contract and the time of day. Roll periods get messy. Thin contracts can feel like ghost towns.
Options are another story. Every strike and expiry has its own mini market. Some are tight, can feel more sure, but plenty of bid and ask options could give quotes wide enough that you’d never hit the screen price unless you absolutely had to. Market makers know the risk they’re taking, so they may widen out when conditions get odd.
Bid and Ask Price in Crypto and Digital Assets
Crypto still behaves like the frontier. Some pairs trade smoothly with narrow spreads. Others jump around even without news. S&P Global’s liquidity scoring makes this obvious, spreads vary sharply from one venue to the next. There’s also the newer wave of crypto ETPs and ETFs. Firms like Flow Traders have pointed out that these products can help tighten spreads for BTC and ETH, though outside the big names, liquidity remains patchy.
Do you Buy at the Bid or Ask? Buy Ask vs Buy Bid
This is one of those questions traders ask early on, then never again after they’ve placed a few real orders. For all the noise in the market, this part’s pretty blunt: when you place a market buy, you’re lifted into the ask price vs bid price. When you sell, you hit the bid.
That’s how matching engines work. It’s the trade-off between being a taker or trying to be a maker. Price takers want in right now, so they cross the spread and accept the cost. Makers may sit on the book with limit orders, hoping someone will come to them. Both approaches can make sense depending on what you’re doing, but anyone running tight stops or short-term signals needs to know exactly what they’re paying for every entry and exit.
Order Types and How They Interact with the Quote
Market orders go straight to the front of the queue, grabbing whatever liquidity sits at the top of the book. Fast, but unpredictable if depth is thin. Limit orders let you set your own level, effectively placing your order on the book as part of the quoted bid ask stack. Sometimes they fill instantly; other times they sit ignored while price dances around them.
Stop and stop-limit orders may complicate things slightly because they trigger into marketable orders once your chosen level is touched. In quick markets, that can mean slipping through several levels before the system finds enough size to fill you. When volatility hits and the bid ask meaning shifts from a calm two-number quote to a jagged mess, slippage becomes something you may need to prepare for.
Bid Size vs Ask Size and Market Depth
After you get comfortable reading a quote, the next thing that starts to matter is how much is actually sitting behind those numbers. Prices move, but they don’t move on their own; they move because size gets taken out of the book. Bid size vs ask size tells you how much is available at the best levels, and once you’ve traded through a few wild sessions, you may stop ignoring it.
“Size” is just the volume posted at a specific bid or ask: shares, contracts, lots, whatever the market trades in. When the visible size on the bid shrinks, price can drop faster than you expect. Same thing on the ask side when buyers stop showing up and nobody wants to be first to post size.
Depth matters even more for anyone trading larger tickets. If you push 300k through EUR/USD during a normal session, it may clear at the top of the book. Try that in an instrument with patchy liquidity and you’ll “walk the book,” meaning you can get filled at worse and worse prices as each level disappears.
Liquidity providers try to soften this effect. When feeds are aggregated through providers such as B2PRIME, clients may access greater depth at the best levels, potentially contributing to more consistent pricing levels.
What Moves the Bid and Ask Rate?
Spreads react to participation, uncertainty, and whatever chaos the market is dealing with at that moment. There aren’t many moving parts, just a few main ones that show up regularly:
Liquidity and trading volume: When a market is active and there’s real interest on both sides, spreads usually stay tight. When participation dries up, clients may notice that everything loosens.
Volatility and macro shocks: Spreads can widen fast when uncertainty hits. April 2025’s Treasury selloff saw spreads jump in a matter of minutes. Depth thinned out, bids pulled back, and the ladder looked shaky the rest of the session.
Differences across asset classes: Some markets handle stress better than others. Crypto is still uneven. Cocoa in 2024 had its own moment, hedge funds stepped out, spreads stretched, and hedgers struggled to get fills without slipping through several levels.
Time of day and session overlap: Liquidity often follows people. When London and New York overlap, spreads tend to behave. When the market slides into quieter hours, quotes drift, and spreads can widen simply because fewer traders are around to keep them tight.
How Bid vs Ask Affect Your Trading Strategy
Every trader eventually figures out that the screen price isn’t the whole story. What really can shape your results is how you enter and exit. The bid and ask rate sits right at the center of that. It dictates your friction, and how much room you actually have to work with.
Short-term traders learn this fastest. Scalpers especially. When you’re trying to catch a few ticks here and there, the spread can chew through half your idea before you’ve even had a chance to be right. Doesn’t matter how clean the setup looks. If liquidity dips or spreads widen at the wrong time, your “edge” may start leaking. A few trades like that and you realize why so many intraday traders obsess over spreads, session timing, and depth sometimes rather than indicators.
Swing traders may have a different experience. A wider spread won’t break the trade on its own, but it does add noise. If you scale in and out, you pay the spread multiple times. If you trade CFDs or crypto pairs with unstable liquidity, the chart might look fine, but the fills tell a different story. Bigger picture traders many times care about avoiding instruments where the spread is far too large relative to the average move. It’s a quiet risk that only shows up on your statement.
Institutional desks think about this constantly. Too much size during a thin moment, and they’ll walk the book and pay for it. That’s where high-quality liquidity comes in, a deeper top-of-book means fewer surprises. B2PRIME’s aggregated pricing was designed with the aim to help in such cases; pursuing smoother fills, steadier quotes, and fewer jumps when you press size.
Understanding Bid vs Ask in Trading
After a while in the markets, you may stop thinking of quotes as numbers and can start treating them like signals. The bid vs ask price is the quickest read you’ll ever get on how willing people are to trade. The traders sometimes perceive tight spread, healthy book, as no big surprises and wide spread, thin depth, as a signal to trade carefully.
The spread tells you the real cost of entering and exiting. Size tells you how much room you have before things slip. If you ignore those pieces, your fills may remind you anyway.
Most traders eventually fold this into their routine: watch the spread, watch the depth, know when liquidity is there and when it isn’t. It makes every decision cleaner. On platforms connected to B2PRIME liquidity, quotes are deisgned to provide access to aggregated market data aimed at producing tighter spreads, deeper books, depending on market volatility and liquidity.
[[aa-faq]]
FAQ
What is bid and ask in stocks?
In equities, the quote shows the best prices buyers and sellers are posting right now. The bid is the highest price someone is willing to pay, and the ask is the lowest price someone is willing to sell at. That small gap is the cost you pay to get in or out, which is why many traders pay close attention to how stable those numbers look on the screen.
What is the difference between bid and ask price?
The difference between bid and ask is the spread. The bid marks the current buying interest, the ask marks the selling interest. If you cross the market, buying at the ask or selling at the bid, that spread becomes an immediate cost. It’s one of the first things active traders learn to factor in when judging whether a trade is worth taking.
Do you buy at the bid or the ask price?
If you place a market buy, it fills at the ask. A market sell hits the bid. There’s no trick to it. That’s why people who care about execution study the spread and ask themselves, do you buy at the bid or ask depending on urgency or whether a limit order makes more sense at that moment.
Why is the bid price lower than the ask price?
There’s a gap because someone needs to take the risk of holding inventory or showing size. That gap compensates liquidity providers. It also widens when markets get stressed by major events or turmoil that no one can reasonably predict.
[[/a]]
[[aa-cta]]
This content is for educational purposes only and does not constitute investment advice, an offer, or a solicitation. Trading CFDs and other leveraged products involves significant risks and may not be suitable for all investors.
[[/a]]
Connect with Our Experts
Our team is equipped to provide solutions precisely to your requirements. Let's explore your options and discuss how we can support your objectives


.svg)

.avif)
.avif)

