Oops! Something went wrong while submitting the form.
Notice: It looks like you are visiting us from United Arab Emirates or have selected it as your residency location.
For accurate information and services under the correct licensed entity, please visit the appropriate section of our website. For more information view Regulatory Information
For accurate information and services under the correct licensed entity, please visit the appropriate section of our website. For more information view Regulatory Information
Ever wonder why some investments move in parallel with others? Enter the world of asset correlation—the factor that influences whether your portfolio holds up or declines during market changes. It has little to do with choosing single assets; it has everything to do with how your assets behave together when the market storms arise. Time to look at the science behind correlation and why it matters.
[[aa-key-takeaways]]
Key Takeaways
You may use asset correlation to combine securities that don’t move in the same direction to reduce risk - a tactic commonly applied by traders in Forex, stocks, and crypto markets.
A portfolio that includes uncorrelated or negatively correlated assets may provide more balanced outcomes over time.e.
Because the correlation is dynamic—some investors monitor it regularly as a part of diversification strategy.
[[/a]]
What Is Asset Correlation?
Correlation of assets is a statistical measure that describes the relationship between the movements of two financial instruments against each other. Asset correlation is sometimes utilized in portfolio management, particularly in portfolios of funds, and used by some traders to help them understand which funds may rise or fall together.
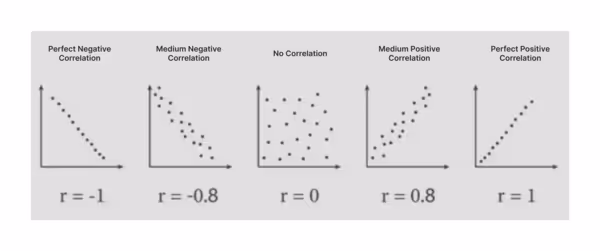
Correlation ranges from -1 through +1. A value of +1 represents a perfect positive statistical relationship, historically—when one asset rose, the other moved in the same direction.
Conversely, a -1 value represents the perfect negative statistical relationship, historically, when one asset moved up, the other asset had reverse movement. A 0 value suggests there is no consistent statistical relationship between the movement of two assetss.
Understanding the correlation of the asset is often considered important since it provides insight to the investors in building their portfolios. When the assets are highly correlated, there is a likelihood that gain and loss can occur simultaneously, which may increase the overall risk.
The opposite effect may occur when the portfolio consists of uncorrelated funds or negatively correlated funds where the volatility in the market can sometimes be reduced - something traders may approach when diversifying between stocks, bonds, commodities, or crypto. In stock selloffs, assets often described as traditional defensive funds like government securities or gold funds may stabilize or gain in price even when there are other areas in the portfolio losing money, though the outcomes vary depending on the market conditions.
Correlation can change over time and may become lesspredictable in the long run, depending on factors such as circumstances in the business cycle or the market conditions. During financial stress, once uncorrelated securities may begin to move together, as as investors liquidate or adjust positions in numerous markets.
Such a phenomenon—sometimes reffered to as the “correlation breakdown”—is one of the reasons why some investors regularly monitor correlation as a part of risk management and strategic asset allocation.
[[aa-fast-fact]]
Fast Fact
During the 2008 global financial crisis, assets across sectors and geographies that were previously uncorrelated suddenly began moving more closely together, which led to losses in many portfolios.
[[/a]]
Types of Asset Correlation
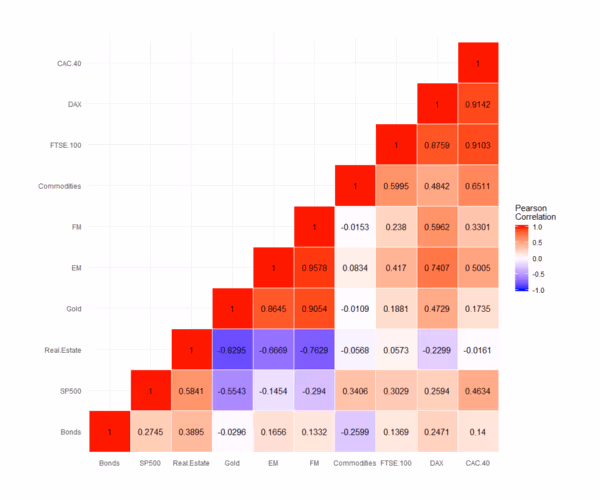
Understanding the various types of asset correlation is considered important in creating an investment portfolio. Correlation refers to the relationship between two or more assets where the fluctuations in the values of the other over time are observed.
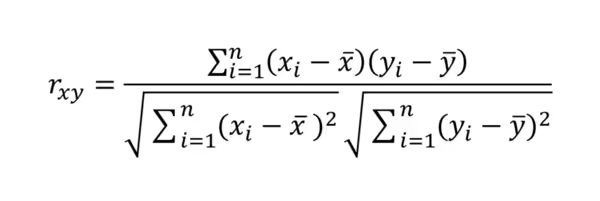
The strength of the linear relationship between the two variables is quantified by the correlation coefficient, whose range is from -1 to +1.
A +1 reading represents an ideal positive correlation, historically—the two securities would follow the same path. A -1 reading represents an ideal negative correlation, historically—the two securities would move in opposite directions in the same proportion.
A reading close to 0 suggests that there is little or no consistent correlation—the movements of the securities appear largely independent of each other. Distinguishing these variations is often considered important in asset allocation, particularly in the context of modern portfolio theory, which examines how combining different securities may help reduce volatility in the portfolio.
Positive Correlation
A positive correlation describes a statistical relationship when two variables have historically tended to increase or decrease together. The closer the correlation coefficient is to +1, the stronger the positive correlation is considered.
A commonly cited example of positive correlation is the relation between stock prices from the oil business and the price of oil. When the price of crude oil increased, the revenue of oil companies—and at times their stock value—of oil businesses have tended to increase as well.
Correlation in the Foreign Exchange are sometimes observed between pairs that share a common currency. For example the pair EUR/USD and the pair GBP/USD since both are valued in the US dollar, they may respond to the similar macroeconomic impulses.
While positively correlated assets may enhance returns during a bull market, they may also increase portfolio volatility during downturns. That's why understanding and monitoring trading correlations as a part of risk management is often considered important for managing risk and creating investment strategies.
Negative Correlation
A negative correlation describe a statistical relationship where two securities tend to move in opposite directions. When one appreciates something in value, the other tends to lose value. The closer the coefficient is to -1, the more negatively correlated the two securities are considered to be. A completely negatively correlated pair would represent the strongest inverse relationship and while such a relationship can provide hedging benefits, in practice correlations can change and do not always remain stable.
Commonly mentioned examples of negative correlations include stock and government securities, as well as stock and gold. Historically,when the stock market is under stress, the investors have sometimes shifted funds from classes, such as stocks, into bonds or gold, and in those cases a negative relationship between the two asset classes has been observed.
Portfolio managers sometimes use negatively correlated or inverse correlation instruments in their portfolio to help manage risk. The approach is frequently referenced in models of asset allocation and is often discussed in modern portfolio theory.
Zero or No Correlation
When two variables are uncorrelated, there is generally no consistent statistical relationship between two securities. In such cases, their price actions may appear to occur at random with respect to one another.
An example might be utility stocks and non-traditional vehicles, such as cryptocurrency, which (on a given time frame) have shown little or no consistent relationship in reaction to the same market movements.
Diversifiers seeking diversification sometimes look at non-correlated assets when aiming to reduce exposure to systemic market risk. Granted, past performance does not necessarily indicate future results; zero correlation may provide diversification benefits but does not guarantee protection.
However, it is important to note that correlation is fluid. Correlations for many assets may change depending on several factors such as interest rates, economic trends, or geopolitical events. Assets showing low correlation today may become highly correlated in the future.
Ongoing analysis is often considered important when the dimension of correlation is used as part of evaluating mutual funds and asset classes.
Why Asset Correlation Matters in Investment?
Correlation is more than a statistical concept—it’s often viewed as an important factor in investment analysis. When we examine how different assets have historically moved in response to one another, investors may gain insights into potential risks and diversification.
Whether independent trader, individual investor or experienced portfolio manager, many consider correlation as one of the several elements that can help draft informed decisions in changing market conditions.
Diversification and Risk Management
Diversification is often viewed as an important element of risk management, and the correlation of assets is frequently considered when assessing its effectiveness. When investors bring into a portfolio vastly correlated assets—especially those with a very positive correlation—their risk is that the positions may move in the same direction in adverse market conditions, which can increase potential losses.
Conversely, including negatively correlated or non-correlated funds in a portfolio may help reduce overall volatility. Stocks and government bonds, for example, historically showed periods of a negative correlation, particularly in the face of an economic crisis, although such relationships are not consistent.
Two funds with perfect negative correlation—whereby one rises exactly when the other falls—would theoretically provide strong diversification benefit. Perfect correlation in reality is extremely rare in real-world markets; even a small degree of negative correlation can contribute to smoothing returns and reducing the impact of price decline.
The diversification that includes various asset classes with diverse levels of correlation is often considered to strengthen the portfolio by decreasing dependence on any given market outcome. However, it does not eliminate risk.
Portfolio Construction
A balanced portfolio is often described as one that seeks to manage a trade-off between risk and reward through asset allocation. That is where asset correlation is frequently considered as one of the factors that can structure the process.
With the diversification of assets whose correlation is low or negative in motion, is often seen as a way to pursue a more balanced relationship between performance and riskprotection.
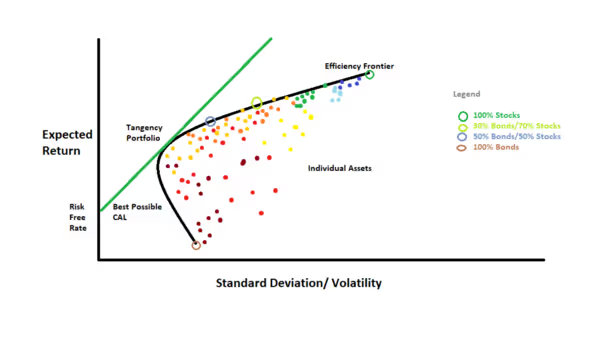
One principle is among the foundations of Modern Portfolio Theory (MPT), which is that diversification through the addition of a variety of assets with low correlation may improve the balance between expected returns and risks.
With MPT, the focus is not on the return of separate assets, but the interrelationships among them at the level of the portfolio. A portfolio containing several assets with varying correlations between them is theorised to contribute to greater stability, although in practise the outcomes can varyt.
Hedging Strategies
Beyond diversification, the correlation between assets is sometimes used in hedging strategies— where investors seek to reduce exposure to adverse price movements. Hedging generally refers to taking a position in an asset with low or negative correlation in effort to offset some of potential losses.
A commonly cited example is the inverse correlation in the relationship observed between the VIX volatility index and the S&P 500 index. Historically, during periods of market turbulence when stocks are moving in a downward direction, the volatility index often rose and some investors viewed it as potential hedging tool. That illustrates the concept of inverse correlation, however this strategy doesn’t guarantee capital preservation.
One of the most commonly used examples is the relationship between equities and gold. While they do not quite demonstrate a perfect negative association, gold has historically at times moved in the opposite direction of equities, during periods of inflation or uncertain times, and some investors viewed it as a potential hedging tool, even though this relationship was not consistent.
Dynamic Nature of Correlations
One of the key features about asset correlation is the fact that it is variable. Correlations can change over time depending on changes such as economic cycle, shifts in monetary policy, or foreign developments. A low correlation between two securities at one point may later move towards a high positive correlation although such changes are not always predictable.
Under conditions of extreme market stress usually uncorrelated assets have occasionally moved in the same general direction. Stocks and commodities, for example, which would often show weak or even negative correlation, have historically been observed to peak and bottom concurrently during periods of systemic market liquidation. On a transient level, the effectiveness of the traditional diversification strategies may be reduced, at least temporarily.
Given the market volatility, some fund managers and investors regularly analyse correlationsrather than relying on earlier assumptions. Markets will continue to evolve, as will the interdependence between theassets. Continuous observation is often considered important for maintaining diversification - which some traders may apply to pursue improvement in their risk management.
Conclusion
In the grand concert of investing, every asset can be seen as singing a unique melody—it’s the harmony (or discord) between them that influences how a portfolio behaves.
Asset correlation is more than a number on a chart—it can be seen as a constantly shifting map of how different assets have historically reacted when the market conditions change. Rather than focusing only on performance—many investors view resilience and diversification as part of a broader risk management approach.
Understanding correlation can provide insights beyond guessing, helping investors analyse how portfolios may respond under different market conditions.—
While diversification and correlation analysis can contribute to a structured approach, they do not guarantee protection against unpredictable outcomes.
[[aa-faq]]
FAQ
What does a correlation of +1 mean in investing?
It means the two assets have a perfect positive correlation, meaning they would theoretically move in the same direction and magnitude. In practice, such correlation is extremely rare.
Why is negative correlation useful in a portfolio?
Because when one asset declines, the negatively correlated asset has historically sometimes moved in the opposite direction, which some traders seen as a potential hedging tool.
Can asset correlation change over time?
Yes. Correlation can be dynamic and can shift over time, sometimes in response to factors like market cycles, policy changes, or global events.
How do traders use correlation in Forex?
In Forex, correlations between currency pairs are sometimes monitored to observe how pairs have historically moved in relation to one another. Some traders use this information as a part of their hedging strategies or risk management, though it does not guarantee accuracy or protection from losses.
[[/a]]
Connect with Our Experts
Our team is equipped to provide solutions precisely to your requirements. Let's explore your options and discuss how we can support your objectives


.svg)