Oops! Something went wrong while submitting the form.
Notice: It looks like you are visiting us from United Arab Emirates or have selected it as your residency location.
For accurate information and services under the correct licensed entity, please visit the appropriate section of our website. For more information view Regulatory Information
For accurate information and services under the correct licensed entity, please visit the appropriate section of our website. For more information view Regulatory Information
Trades in Forex can be likened to traversing a stormy ocean—unpredictable, turbulent, and risky. While no tool eliminates uncertainty, technical indicators are widely used by traders to support market analysis and decision making to interpret the currents and sail through with ease.
That’s where Forex indicators come in. These tools are designed to support informed , data-driven trading approaches making you sharper, and assist with your decisions.
In this guide, we explore five commonly used Forex indicators that can help you interpret price trends, assess momentum, and better understand market behaviour.
[[aa-key-takeaways]]
Key Takeaways
Indicators are tools, not crystal balls – Use them for clarity, not certainty.
A balanced approach works best – Combine trend, momentum, and volatility tools.
Forex indicators are tools used in technical analysis to help interpretprice action and support data-informed decision making in the foreign exchange market. Unlike purely intuitive approaches, these indicators are based on historical patterns related to price, volume and momentum. Forex indicators come in the form of overlays overlaid over price charts or as separate visual graphs below the chart, offering traders an additional layer of analysis to help identify potential market trends and behaviours. While not predictive, these tools are commonly used to assist in forming a structured trading approach.
In a way, indicators are an additional pair of eyes. They alert you to trends, reversal spots, entry, exit, or even volatility in the market. No indicator is flawless, though a few offer a well-rounded view of the market when combined with liquidity data and other market inputs, such as those available through institutional-grade providers like B2Prime.
Choosing good indicators is primarily a matter of your trading style. For instance, short-term traders may favour momentum-based tools, whereas those focused on longer-term trends might use smoothing indicators to reduce short-term fluctuations. While indicators do not guarantee outcomes or eliminate risk, they can support more structured decision-making and may help reduce reliance on emotion in volatile conditions.
[[aa-fast-fact]]
Fast Fact
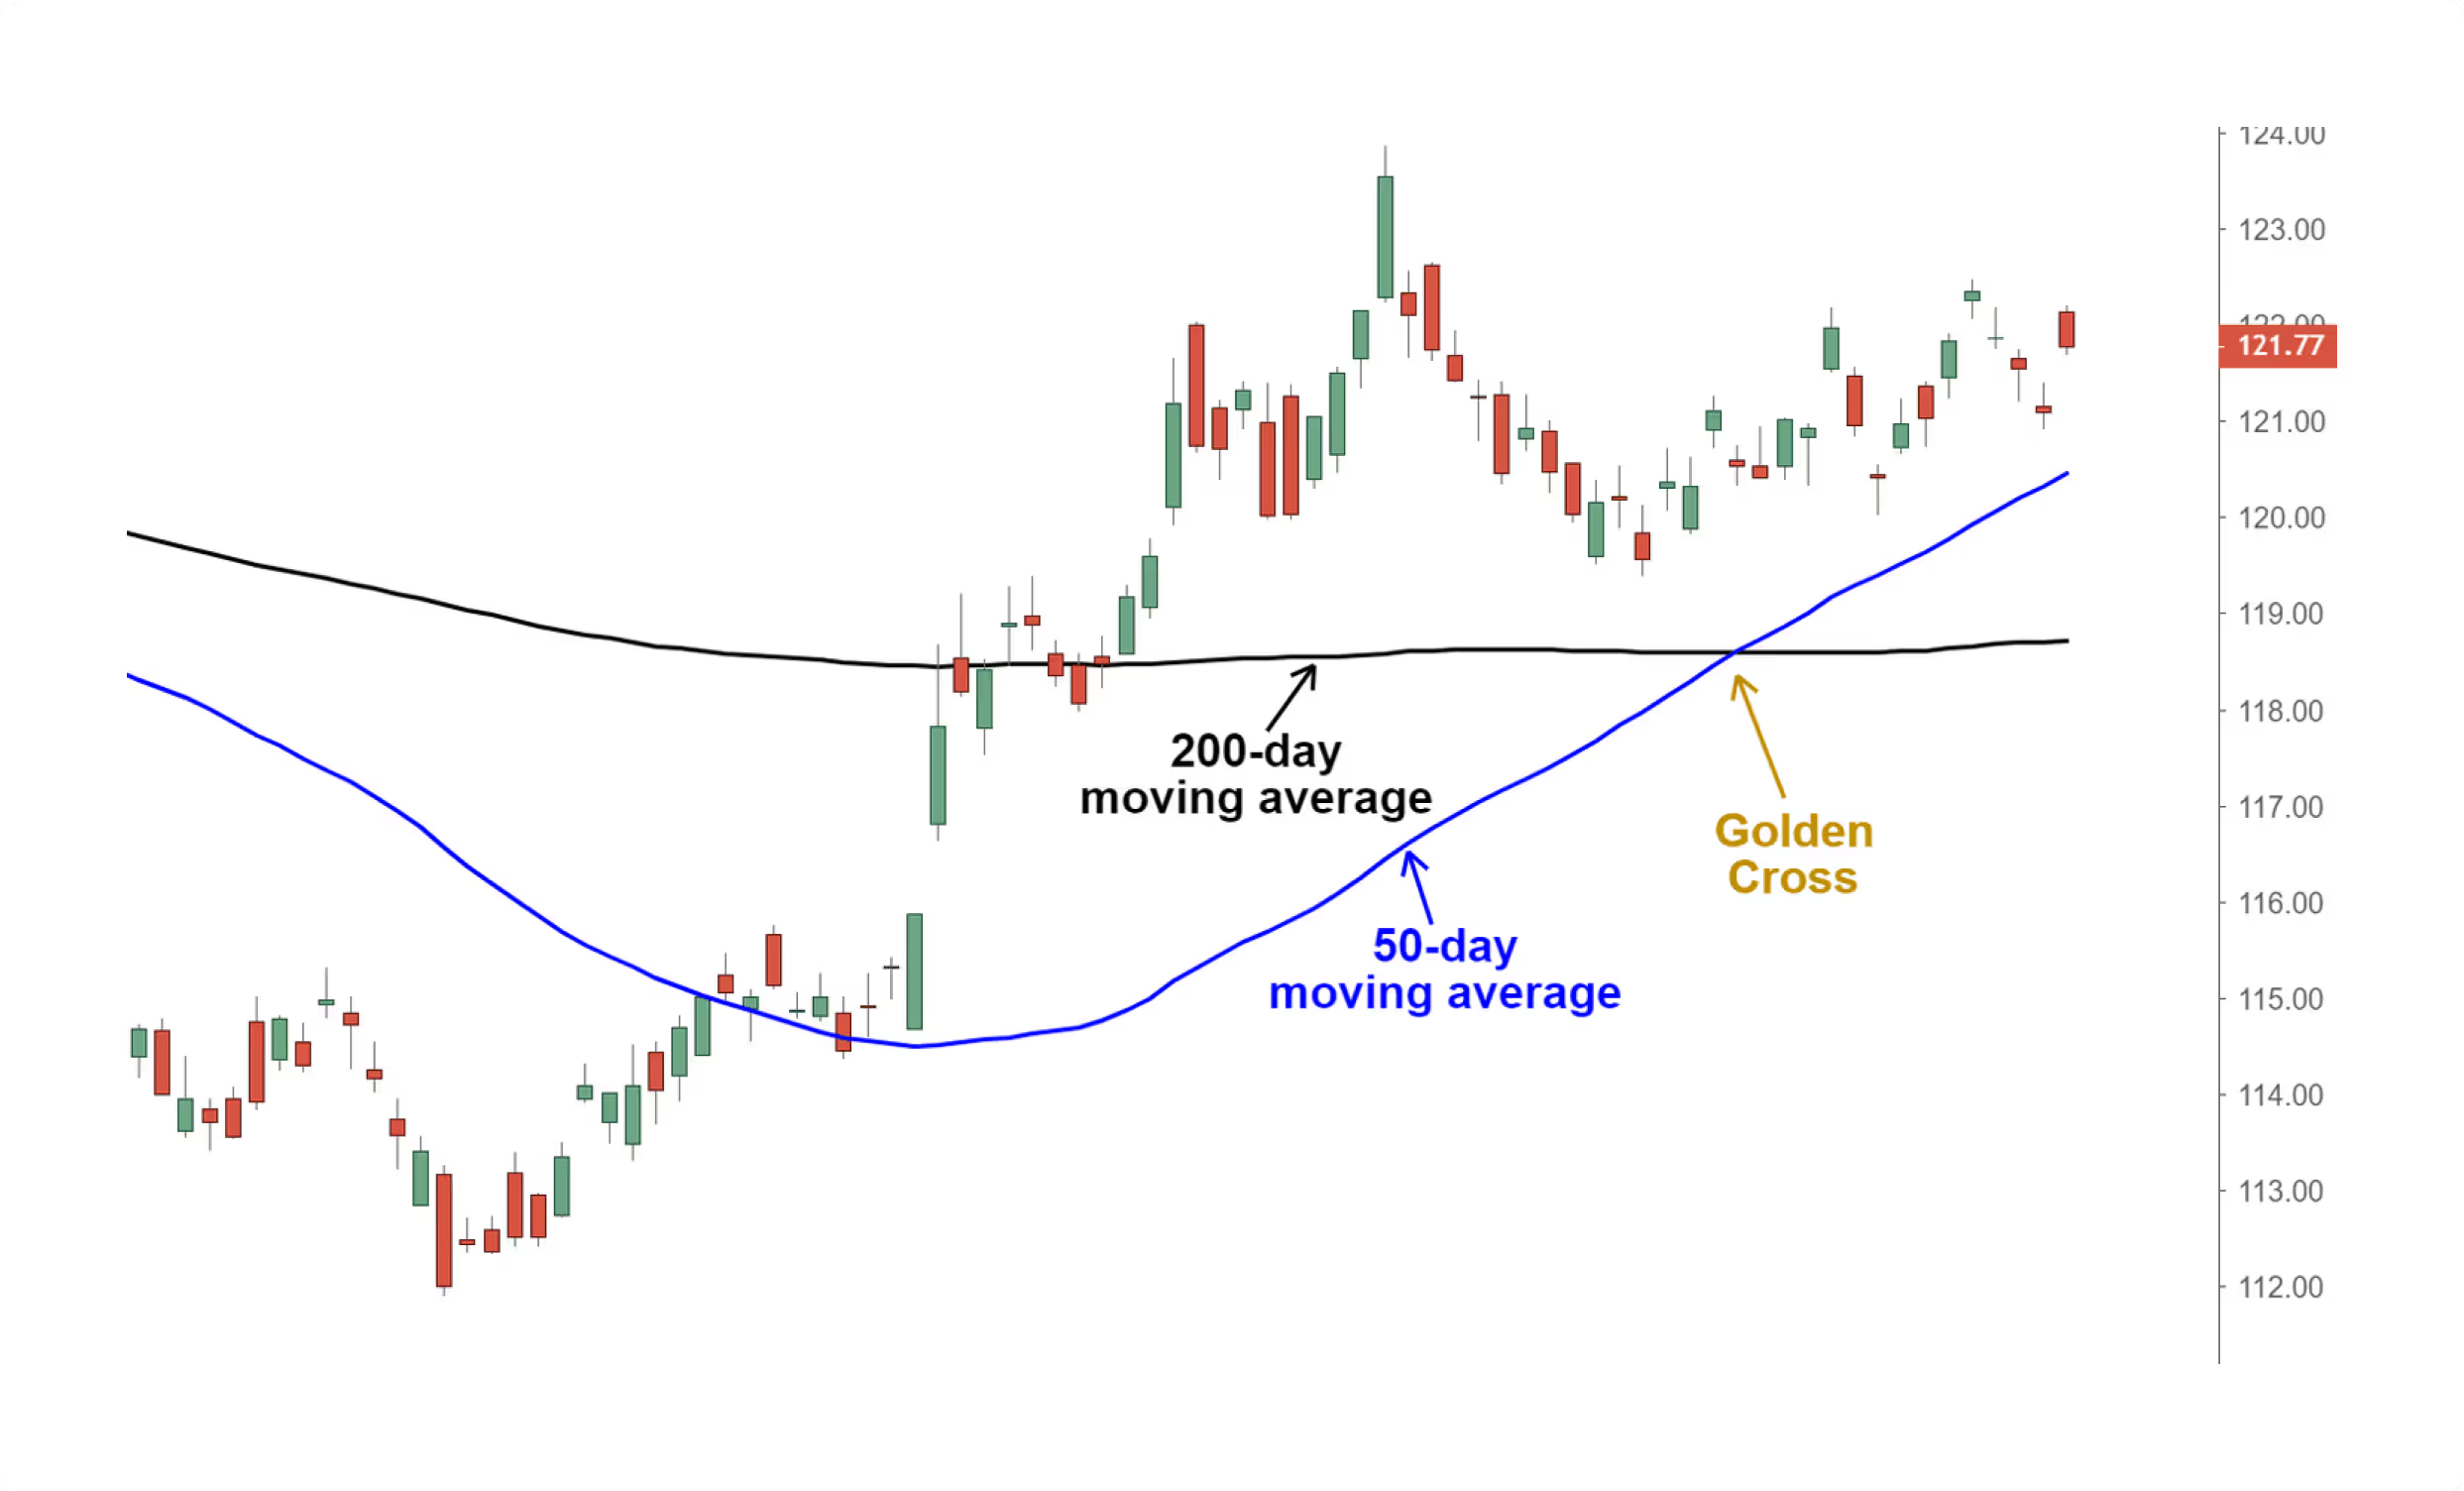
Golden Cross (50-day MA crossing above the 200-day MA) is one of the well-watched bullish signs in any financial market.
[[/a]]
Top 5 Forex Trading Indicators Every Trader Should Master
It can be difficult to navigate the Forex market without the right tools. Fortunately, there are Forex trading indicators that are widely used by traders to observe price trends, assess volatility, and support the development of structured trading strategies.
Below are five commonly used Forex indicators that assist in analysing market conditions, identifying potential trend direction, and informing entry and exit considerations. These tools are not predictive but can support a data-driven approach to market evaluation when used appropriately.
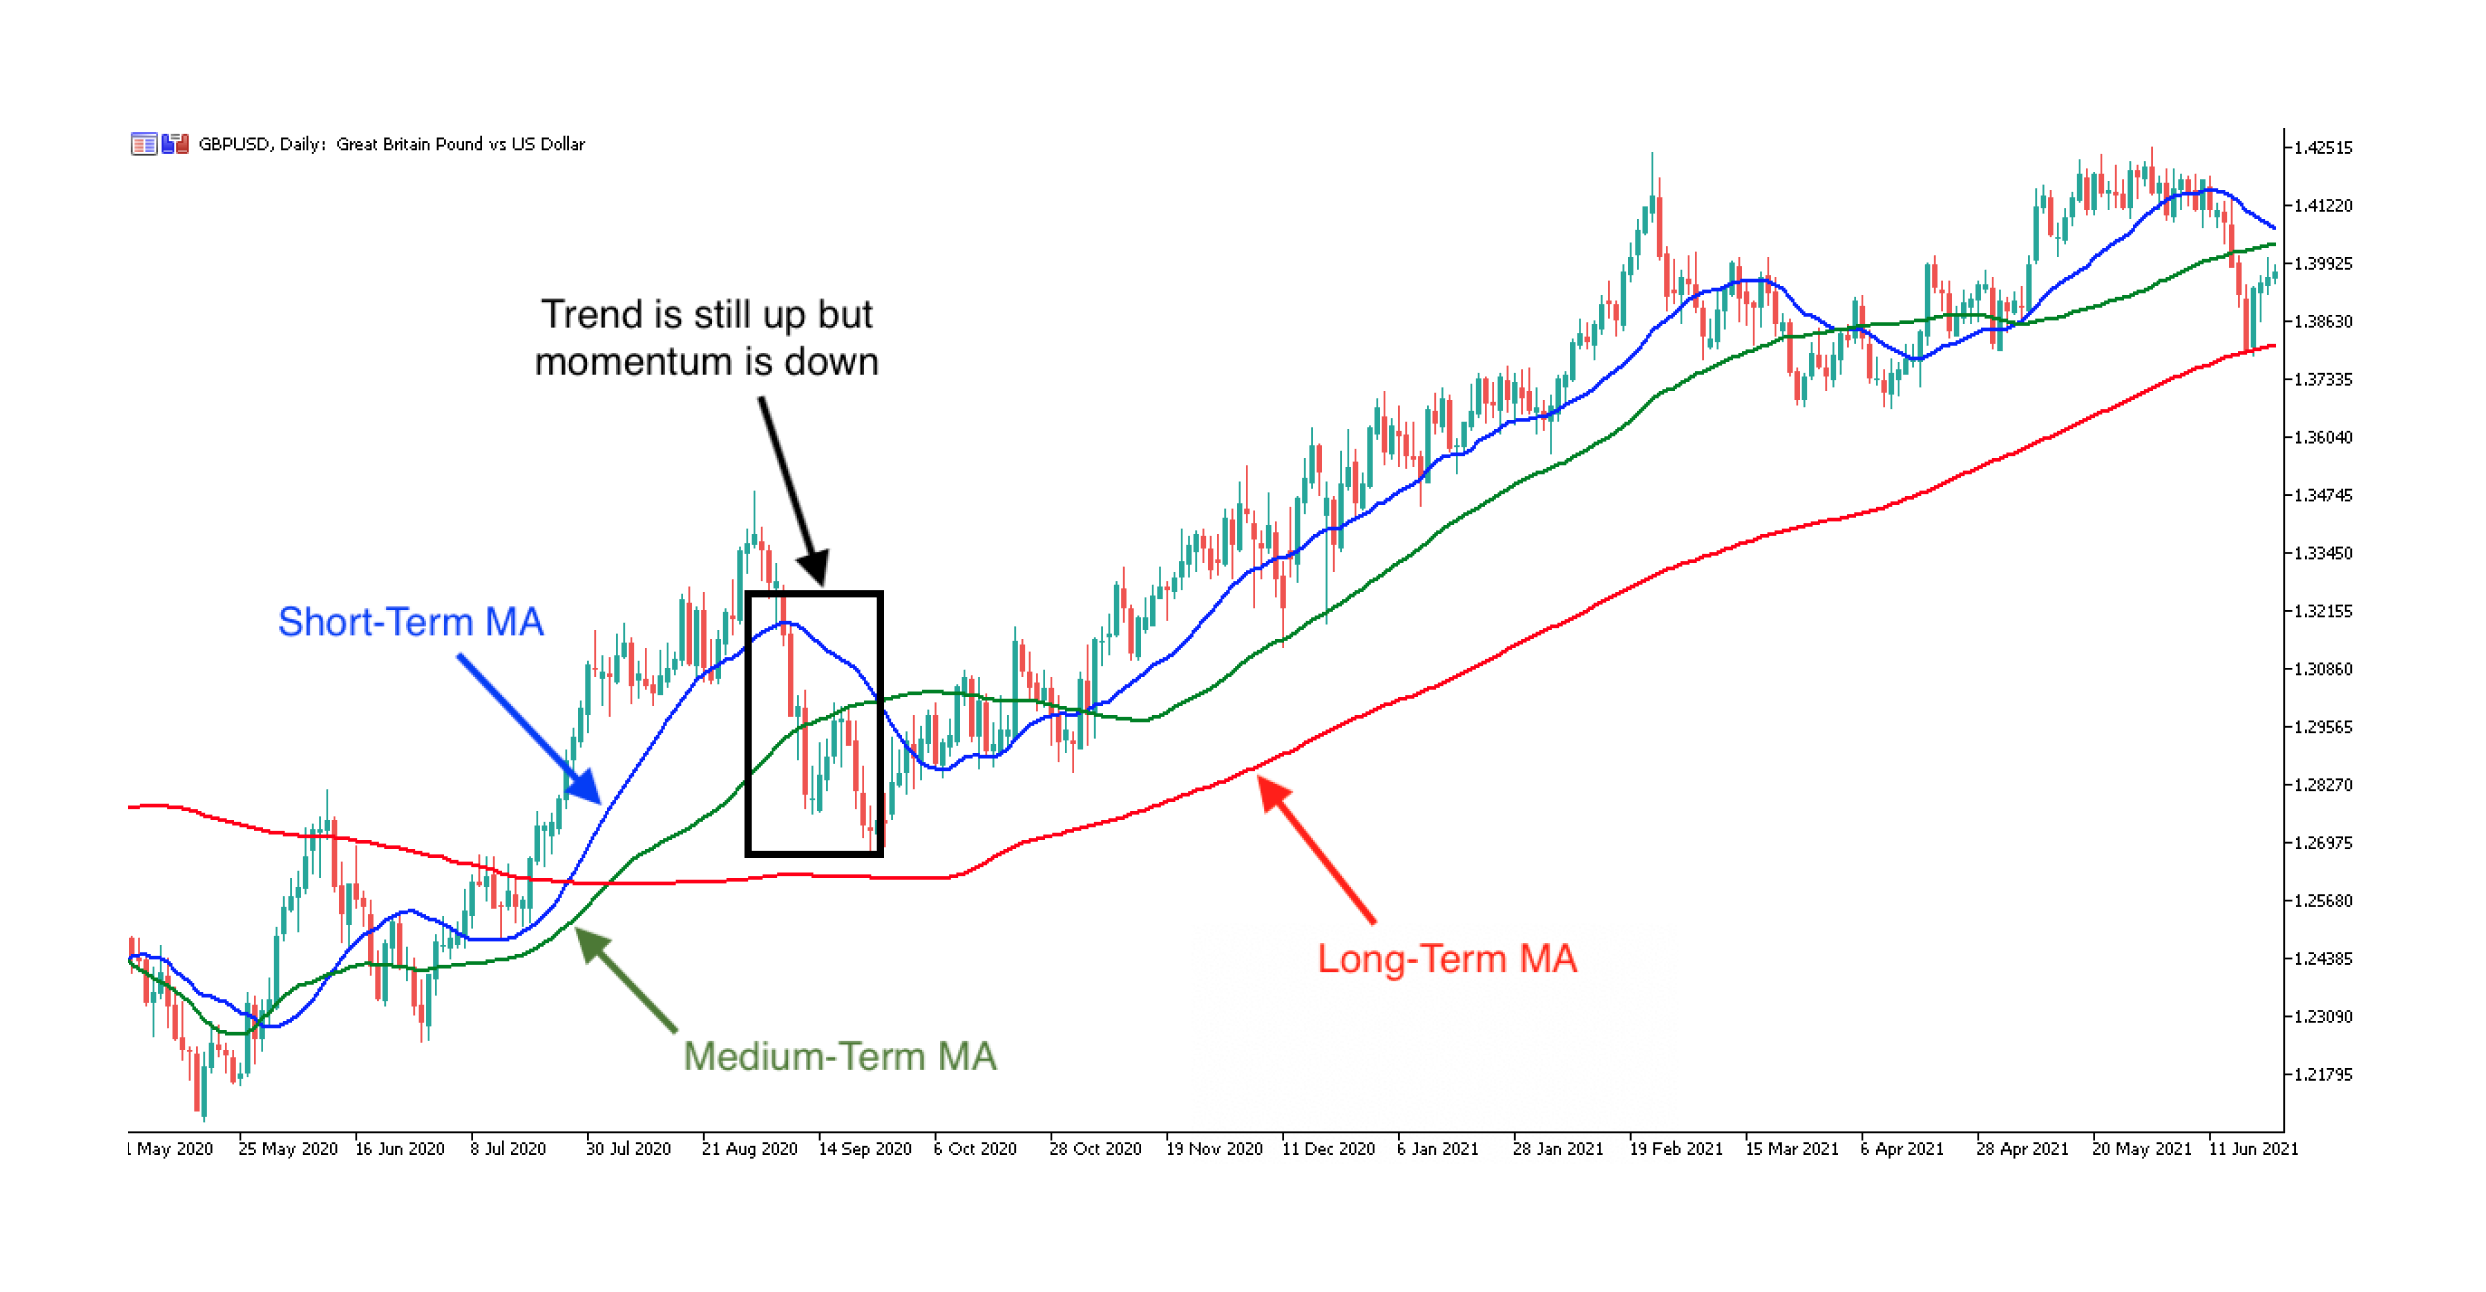
Moving Averages (MA)
Moving averages are a classic technical analysis tool that help smooth out short-term price fluctuations to provide a clearer view of broader market trends. As a trend-following indicator, they are often used to identify potential areas of support and resistance and to assist in interpreting directional momentum over time.
There are also two broad categories: the Simple Moving Average (SMA) and the Exponential Moving Average (EMA). The SMA calculates the average price over a defined period, offering a smoother and more gradual view of price trends. The EMA, by giving more weight to recent price data, reacts more quickly to market changes and is often used to highlight short-term movements.Another widely used approach involving moving averages is the crossover method. For example, when a short-term 50-day EMA crosses a long-term 200-day EMA, some traders interpret it as a possible bullish signal—a phenomenon known as the Golden Cross. However, when the smaller average crosses below the larger average, a bear reversal can be seen, also referred to as the Death Cross, sometimes associated with a potential downward trend. These interpretations are based on historical patterns and should not be considered predictive.
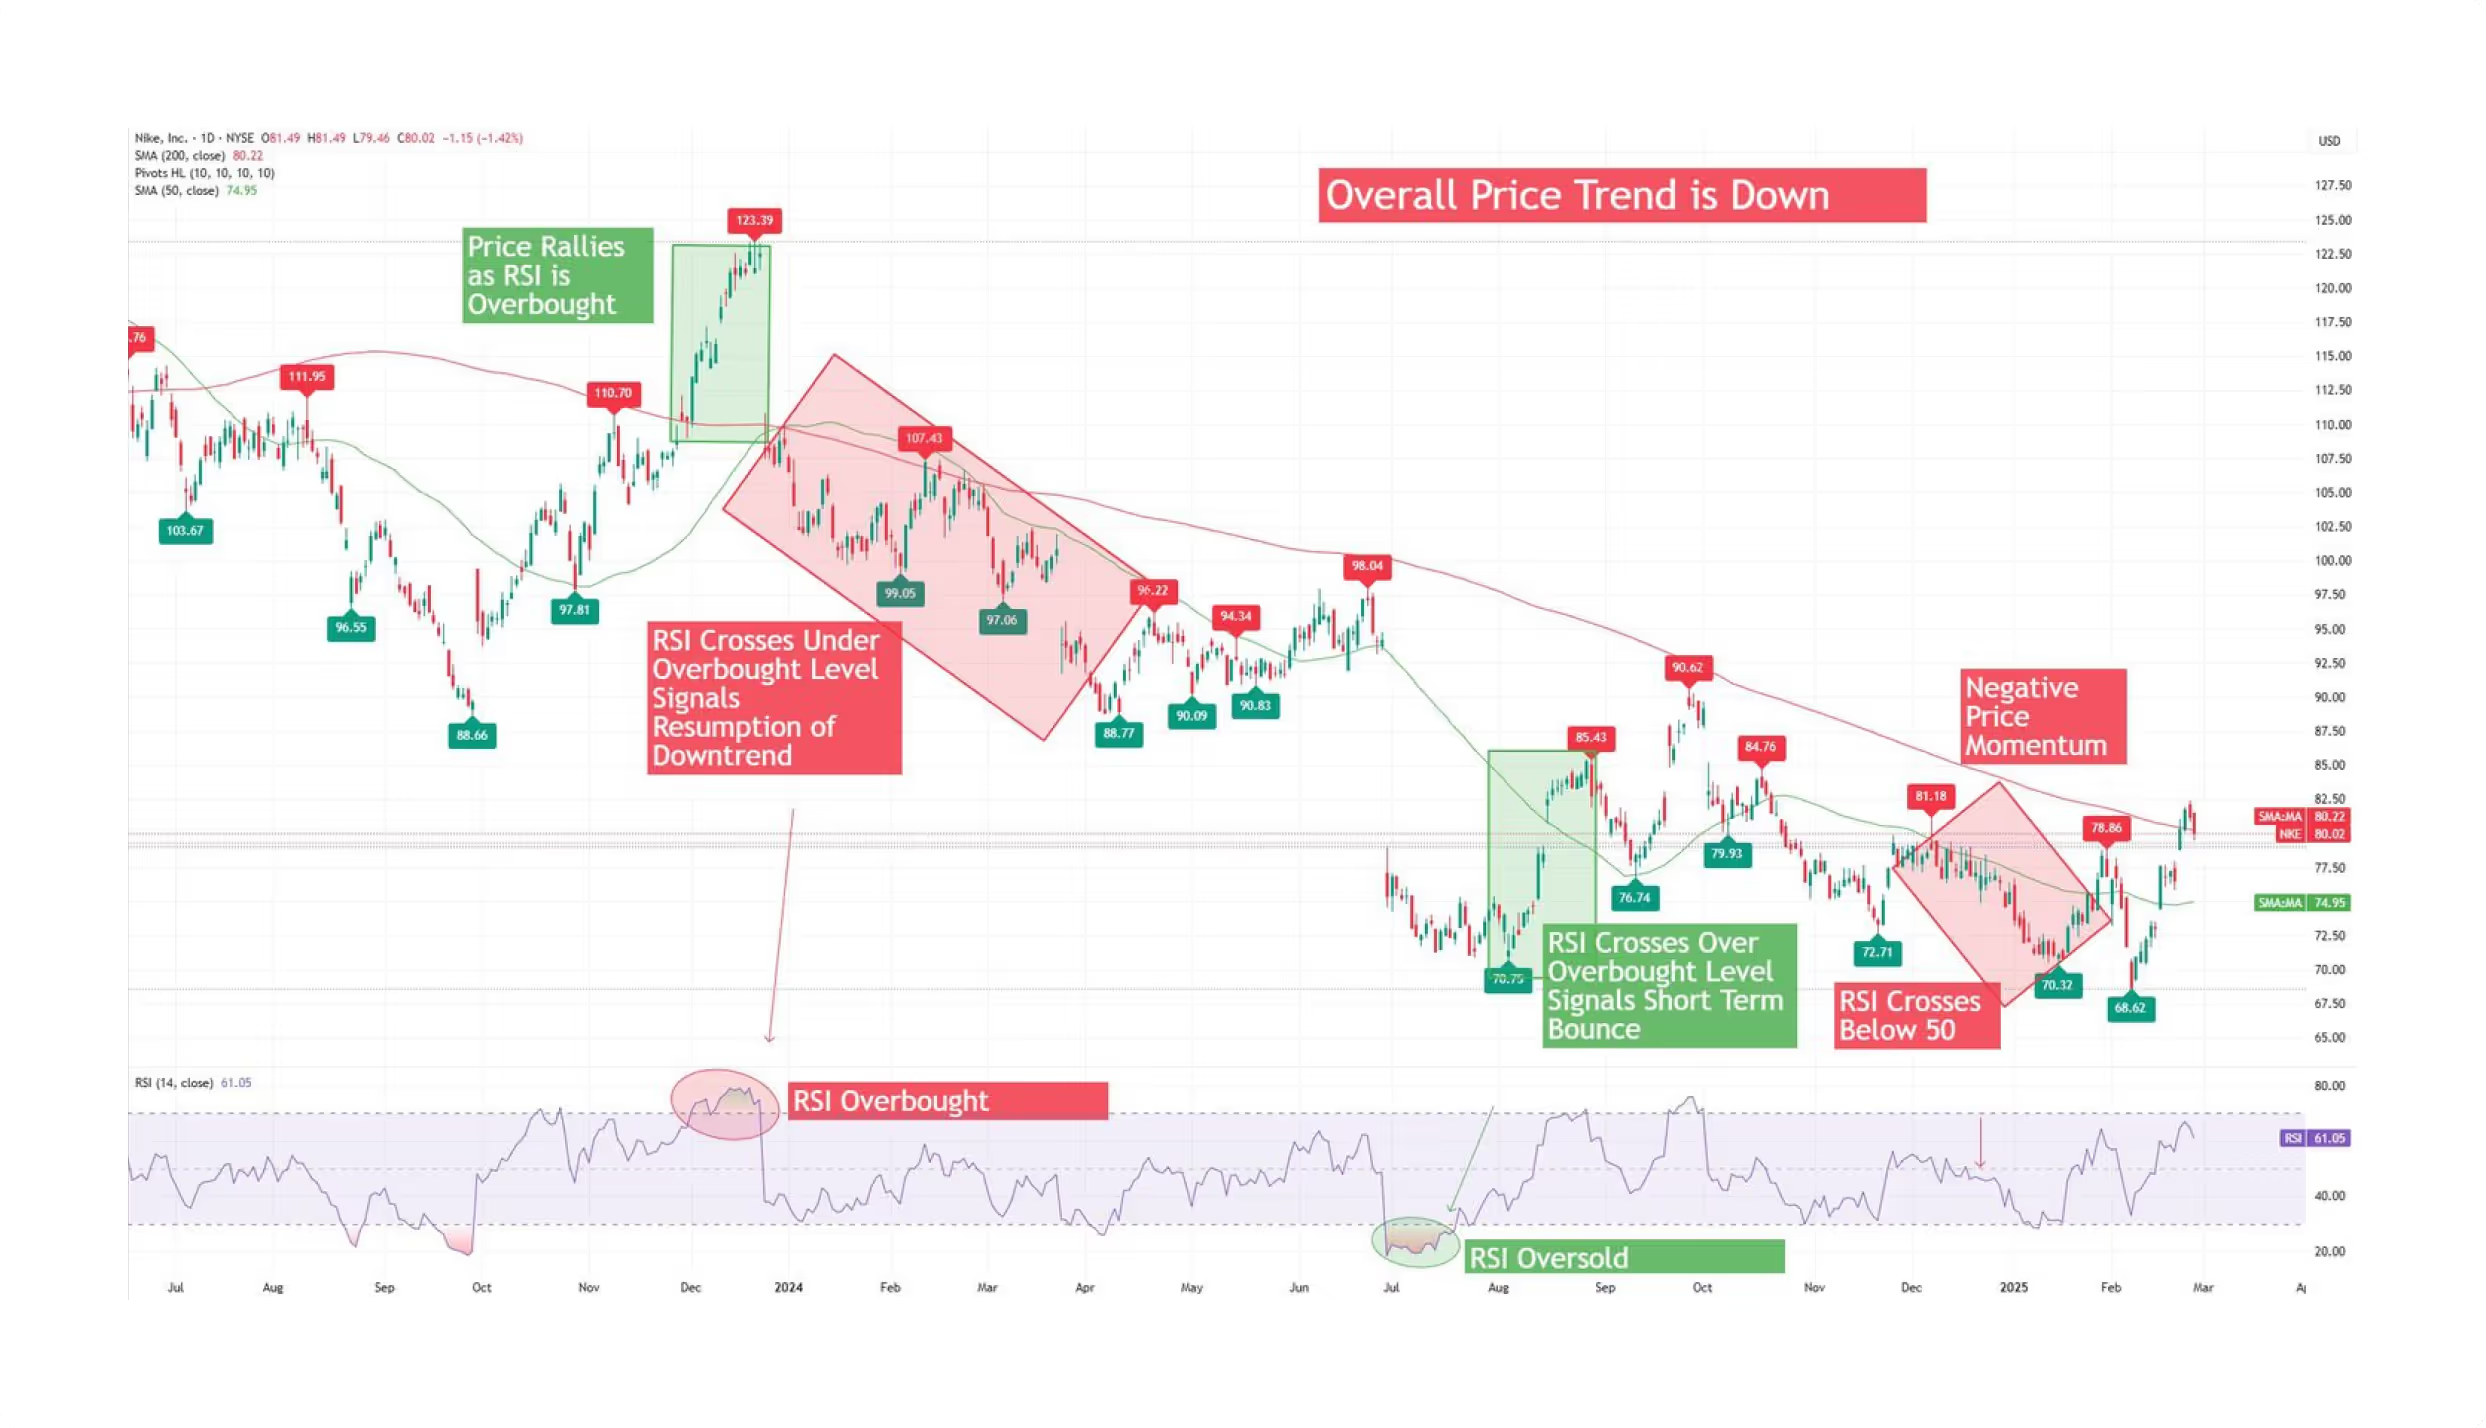
Relative Strength Index (RSI)
The Relative Strength Index, or RSI, is a strong momentum-based technical indicator that measures speed and magnitude of recent ptoce movements on a scale from 0 to 100. It is commonly used to help identify market conditions that may be considered overbought and oversold, providing a trader with a reference for potential point of price reversal.
An RSI reading over 70 often interpreted by traders as a possible indication of an overbought situation where a market may be due for a retracement. While a reading of less than 30may suggest an oversold situation where a reversal in prices may be long overdue. In practice, RSI signals are often considered alongside other tools, such as price action analysis or complementary technical indicators, to provide additional context.
Short time frames, such as the 1-hour or 4-hour, may be used to explore short-term setups, whereas longer time frames like the daily chart are generally referenced for observing broader trend conditions. RSI is frequently combined with indicators such as the MACD or Bollinger Bands to support multi-factor analysis, though it should not be relied upon in isolation for trading decisions.
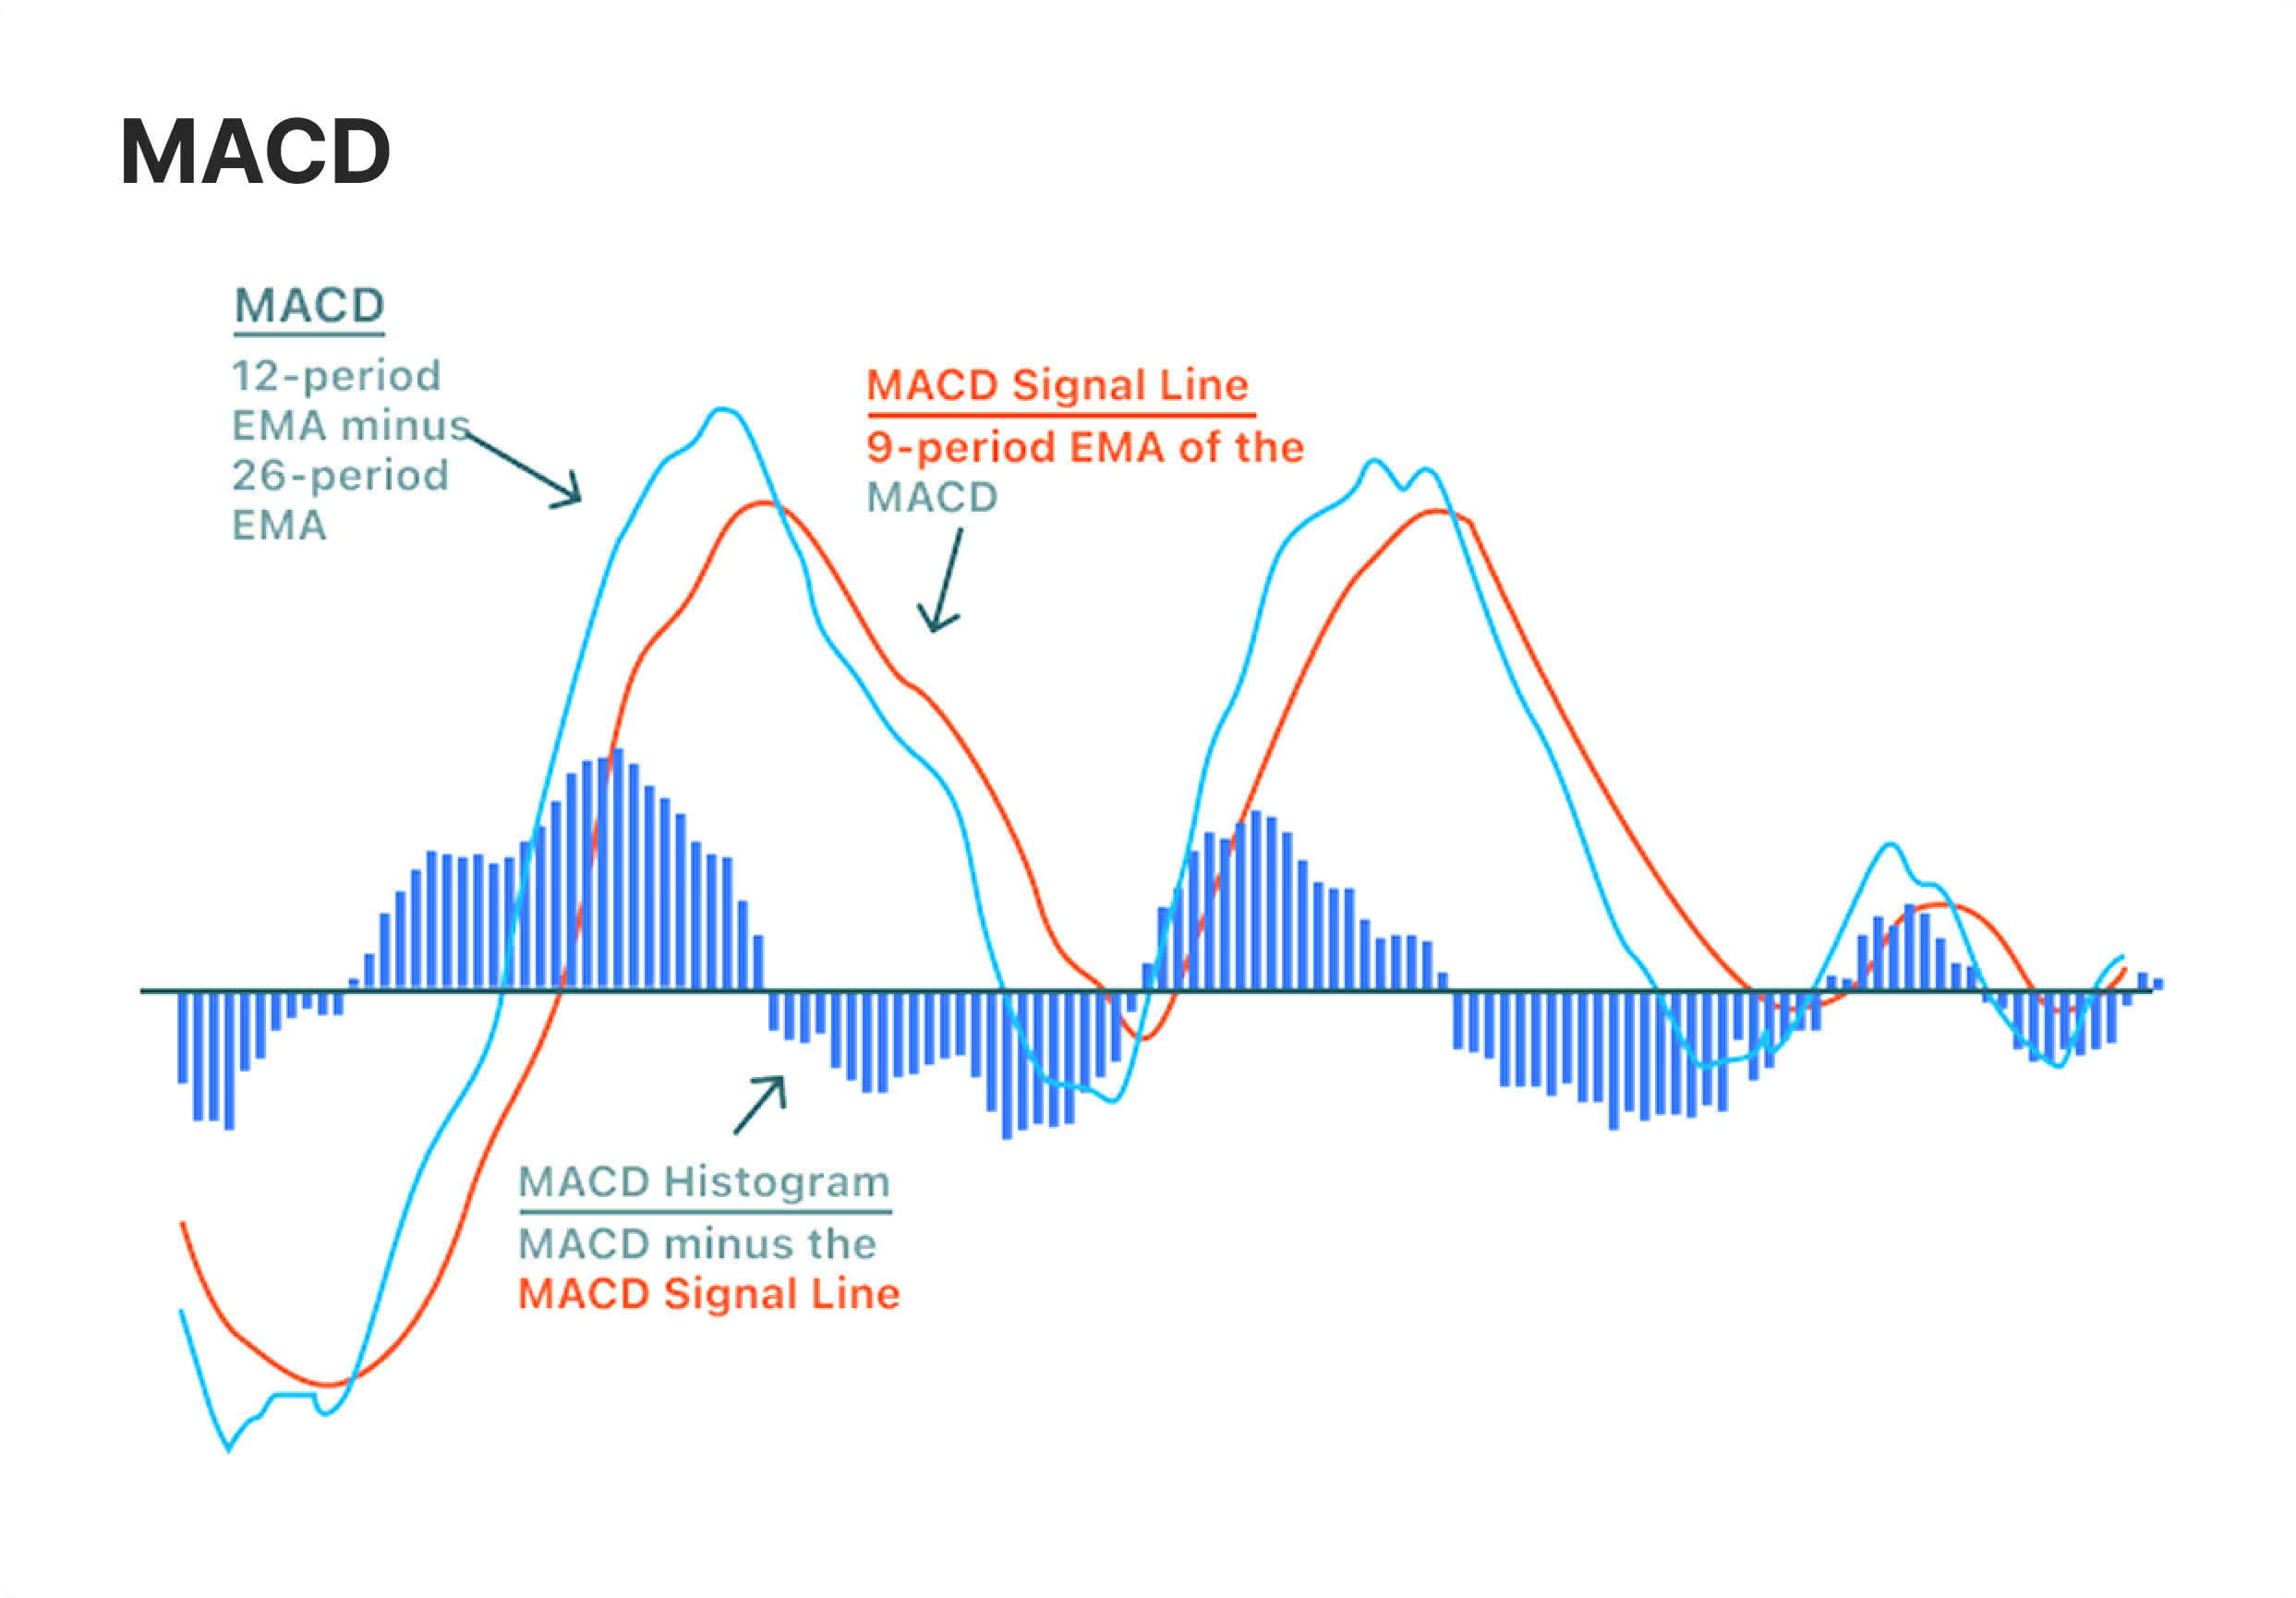
Moving Average Convergence Divergence (MACD)
Moving Average Convergence Divergence (MACD) is a technical indicator that combines elements of trend-following and momentum anaysis It is commonly used by traders to observe changes in the strength, direction, and duration of a price trend.. It is constituted of three elements: the MACD line, the signal line, and a histogram.
The MACD line is derived from a shorter-period EMA subtracted from a longer-period EMA. The signal line, being a moving average of the MACD line and it is commonly used to identify potential changes in momentum.
When the MACD line crosses above the signal line, some traders interpret this as a possible bullish signal; conversely, a cross below the signal line may be seen as indicative of potential bearish momentum.
What gives the MACD additional value is the fact that it can illustrate possible changing trend strengths. Its histogram can help traders to highlight the pace at which momentum is shifting, offering a more real-time perspective than static price levels.
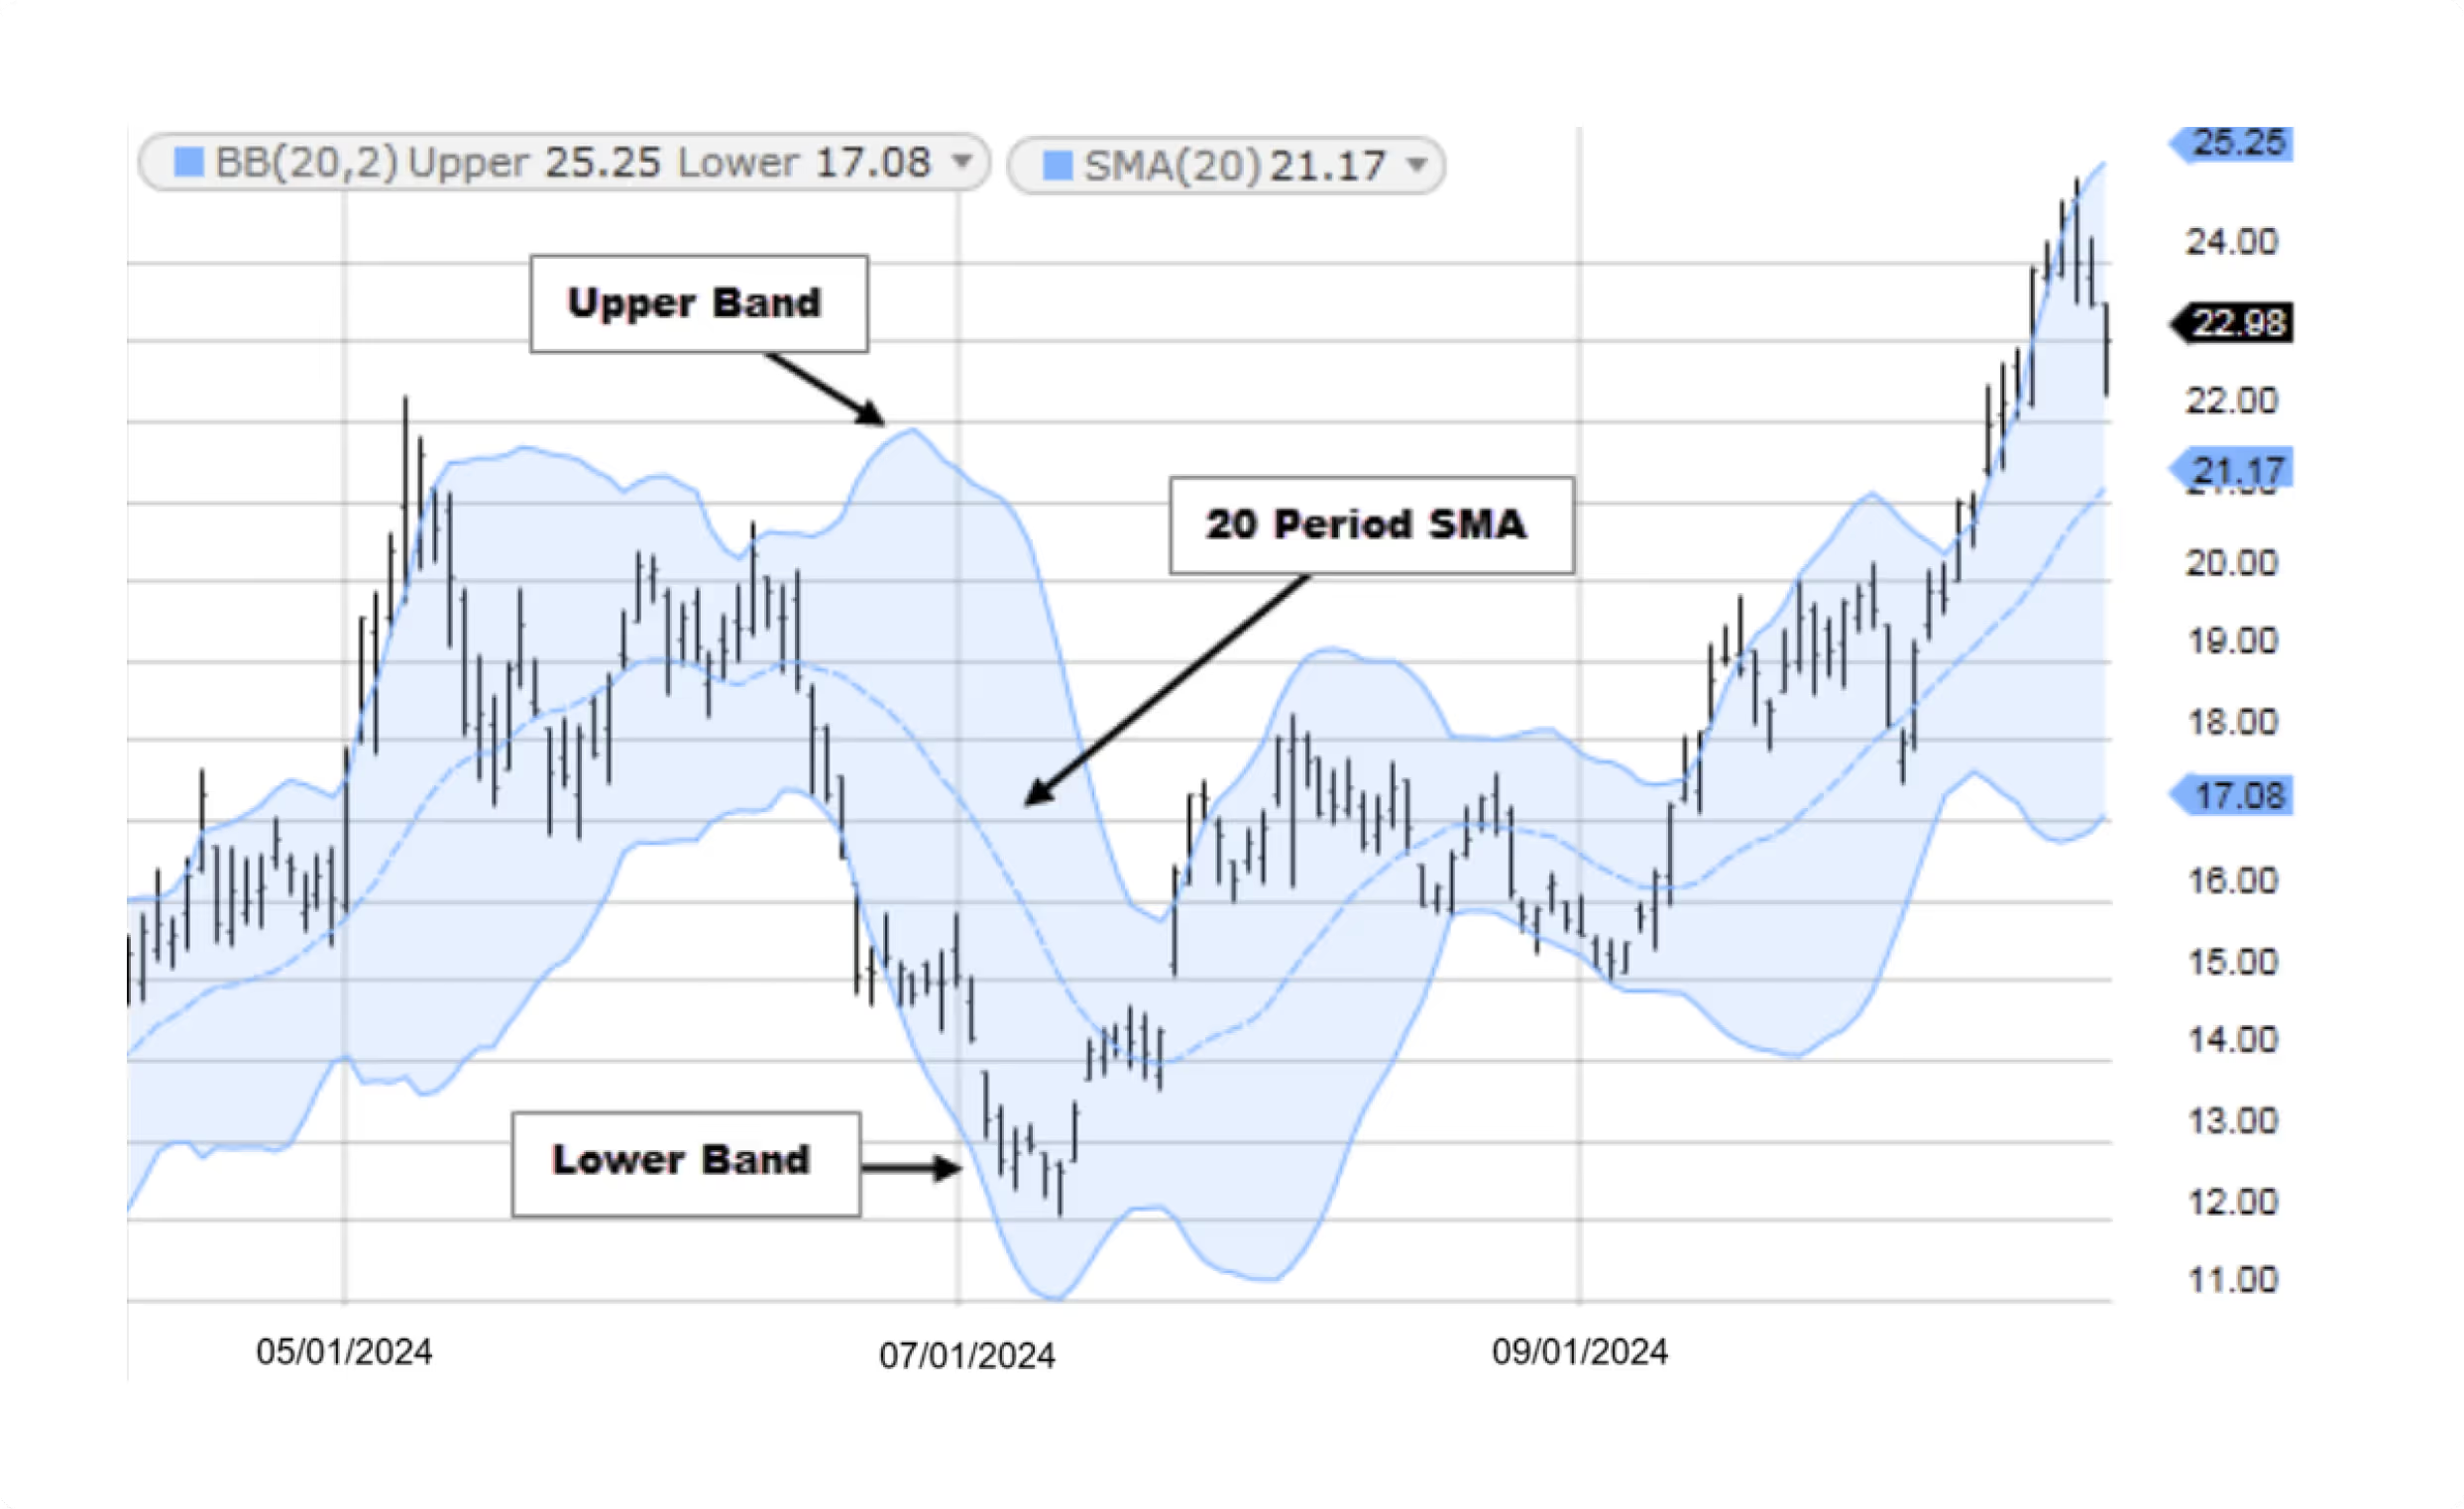
Bollinger Bands
Bollinger Bands are a widely used technical indicator designed to measure market volatility. The indicator consists of three lines in total: a centre simple moving average, with two outer bands placed two standard deviations above and below. Those outer bands expand and contract around existing price action.
When the bands contract, this is generally interpreted as a period of reduced market volatility and a possible breakout. When the bands are expanding, often reflect rising volatility and are sometimes observed during trend development or continuation Traders may pay attention when prices approach or temporarily move beyond the outer bands, particularly when combined with other signals, such as price rejection patterns or candlestick formations.Prices touching or breaking through the outer bands are something traders pay close attention to, especially when in conjunction with rejection candles or reversal patterns in the price chart.
While Bollinger Bands are often applied in range-bound market conditions, they may produce less reliable signals during strong trending phases. For a more comprehensive analysis, this indicator is sometimes used alongside momentum tools such as the Relative Strength Index (RSI) or Stochastic Oscillator.
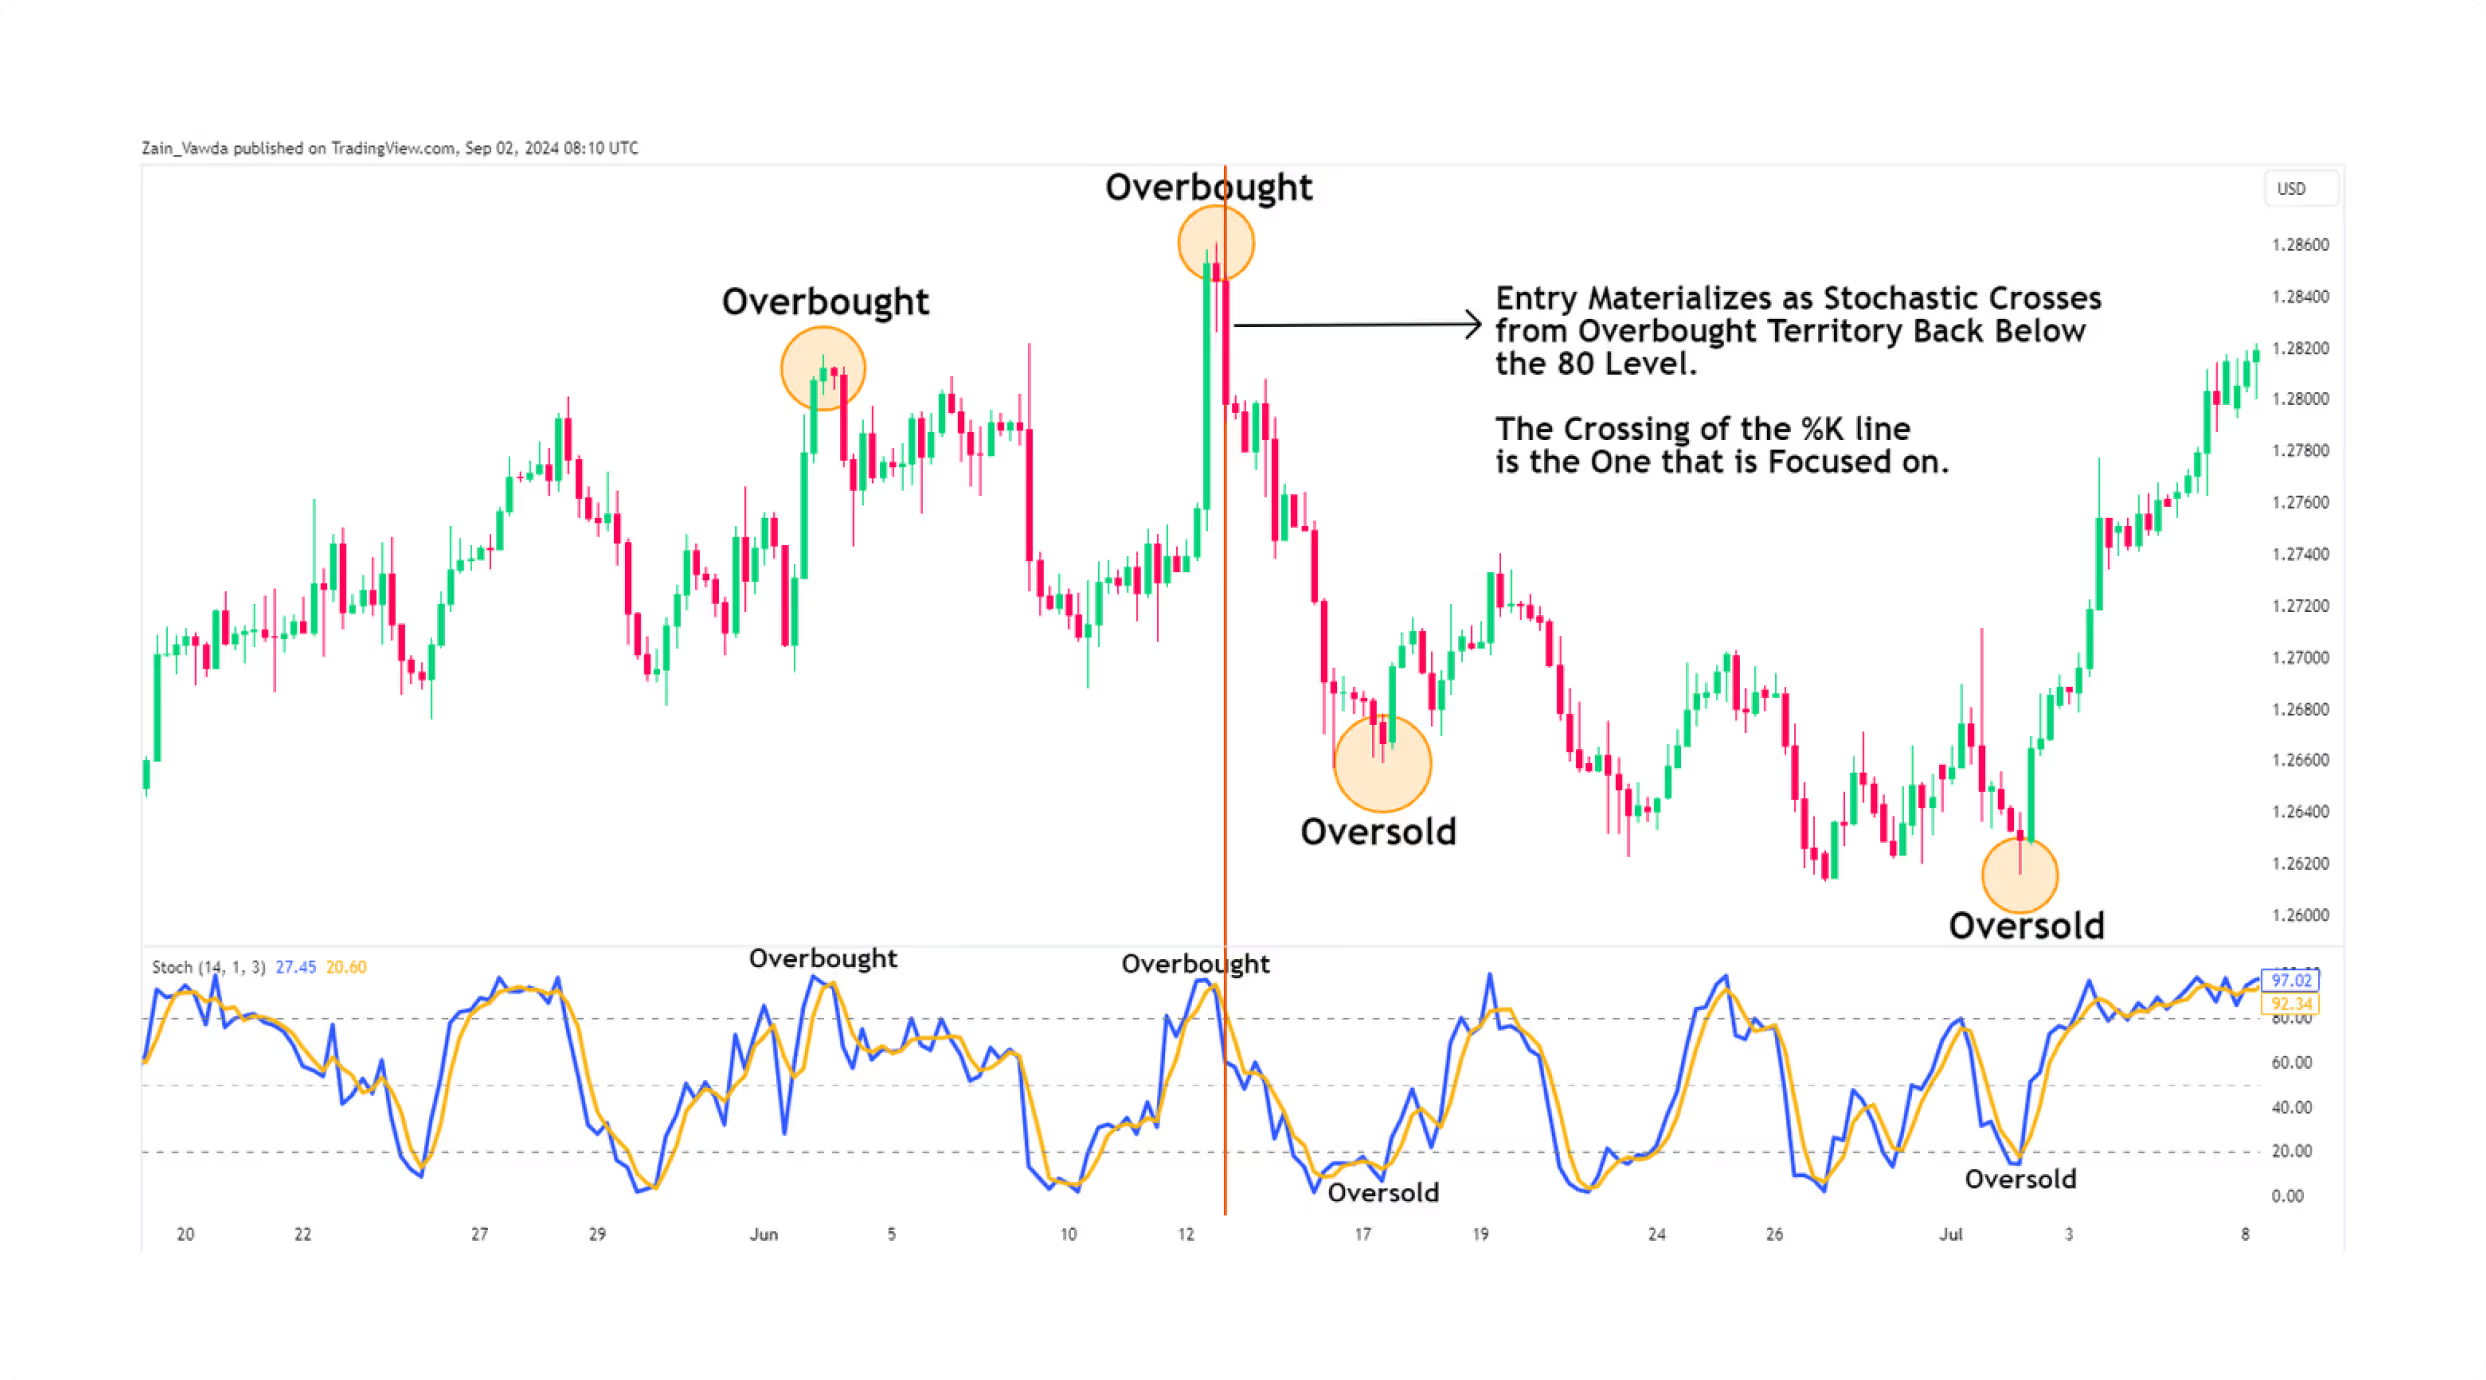
Stochastic Oscillator
The Stochastic Oscillator is a momentum based technical analysis tool that compares an asset's closing price to its price range over a defined short time period. It consists of two lines in which %K is short-term, while %D is a smoothed version of %K. Overbought is above 80, while oversold is below 20.
When the %K line crosses below the %D line in the upper part of the scale (commonly referred to as the overbought zone), it may be interpreted by some traders as a possible weakening of upward momentum. Similarly, when %K crosses above %D in the lower part of the scale (the oversold zone), it may suggest a potential increase in buying interest.
The Stochastic Oscillator is commonly used in range-bound markets, where where traders may seek to identify short-term price fluctuations.. It is widely used among consolidating market traders, where momentum indicators tend to outperform trend-following indicators.
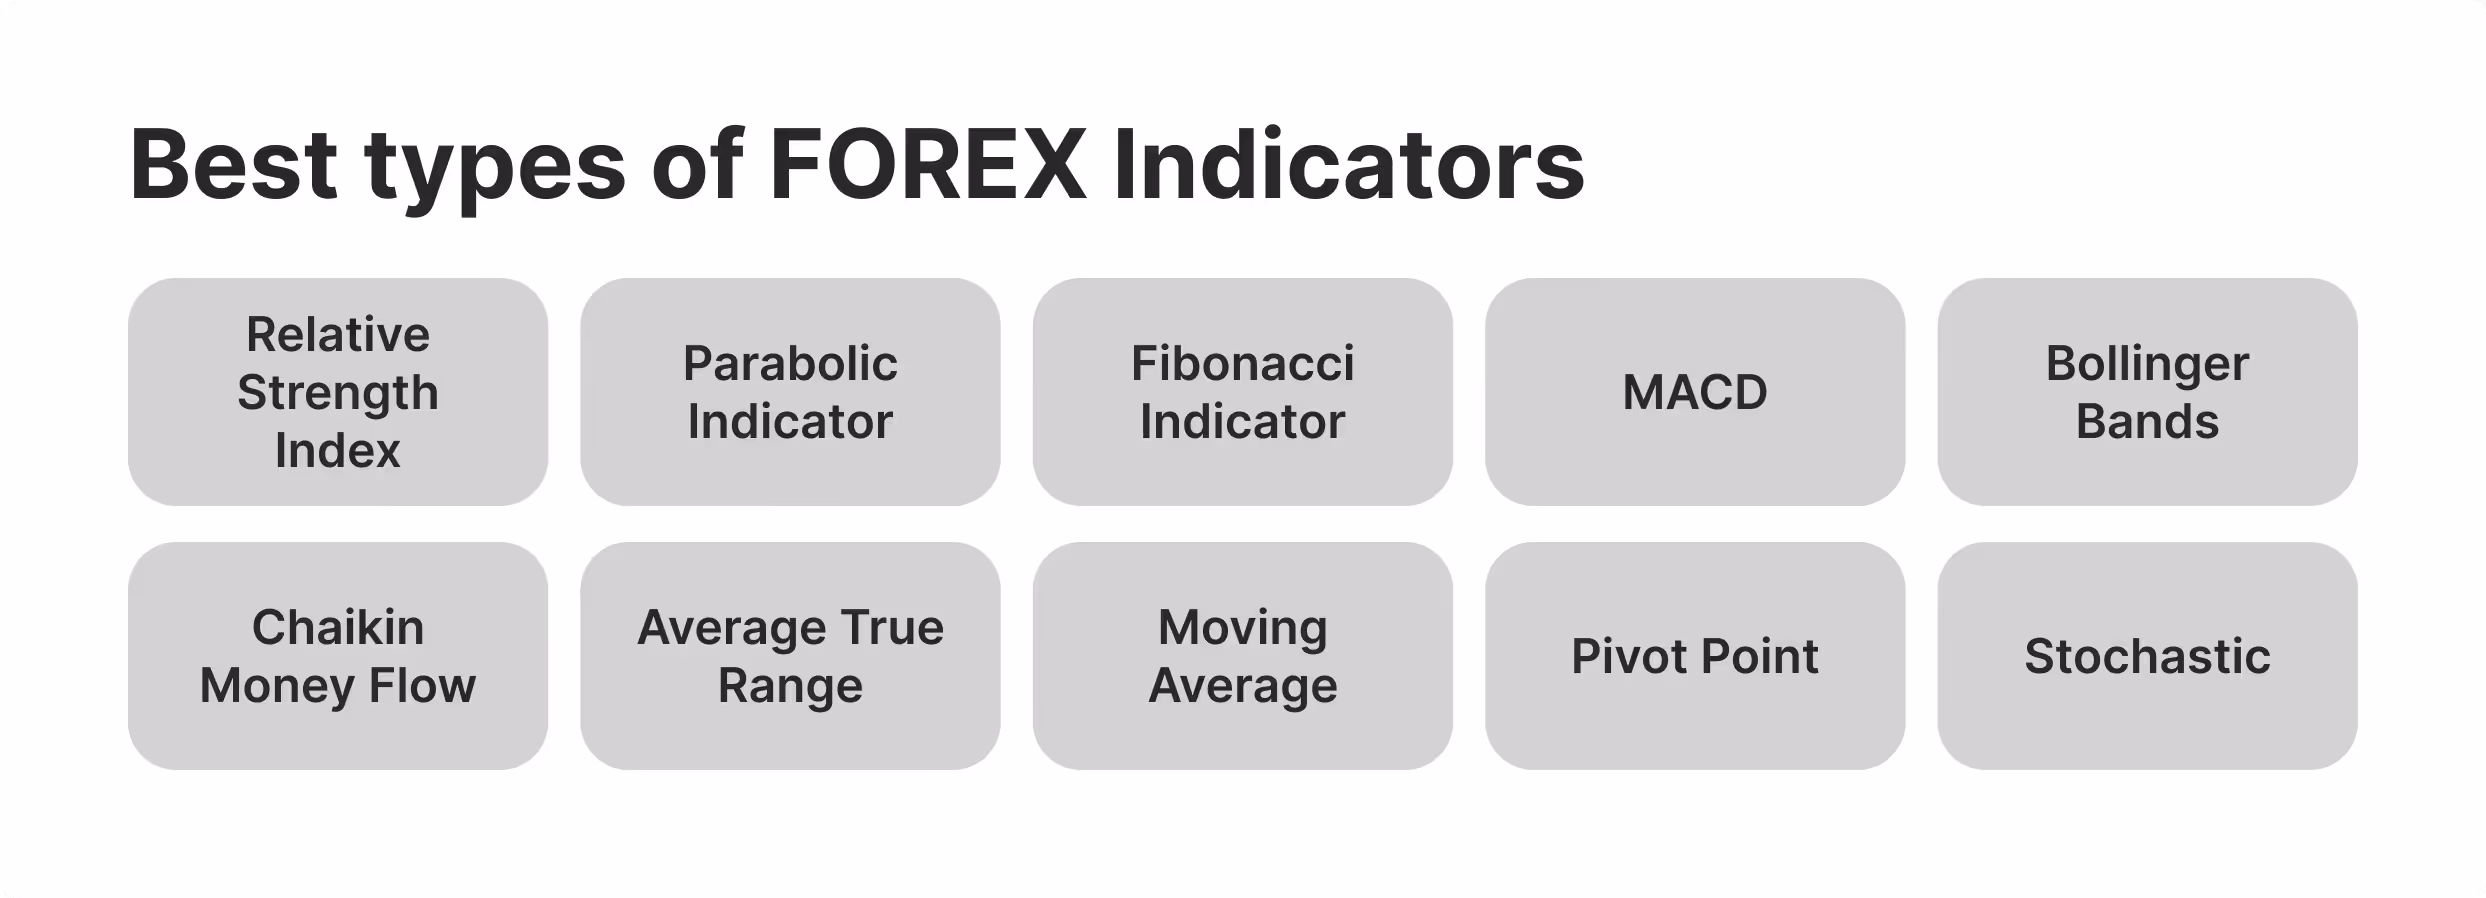
Types of Forex Trading Indicators
Forex tradeing indicators fall in some very broad categories, with each type offering insights into different aspects of market behaviour. These may include tools designed to help a trader comprehend a different market behavior in a clearer fashion.
From making a leap into a trend in an early phase to evaluating a move's strength and making a volatility estimate, a good working understanding of each type of indicator can provide a clearer edge in making decisions.
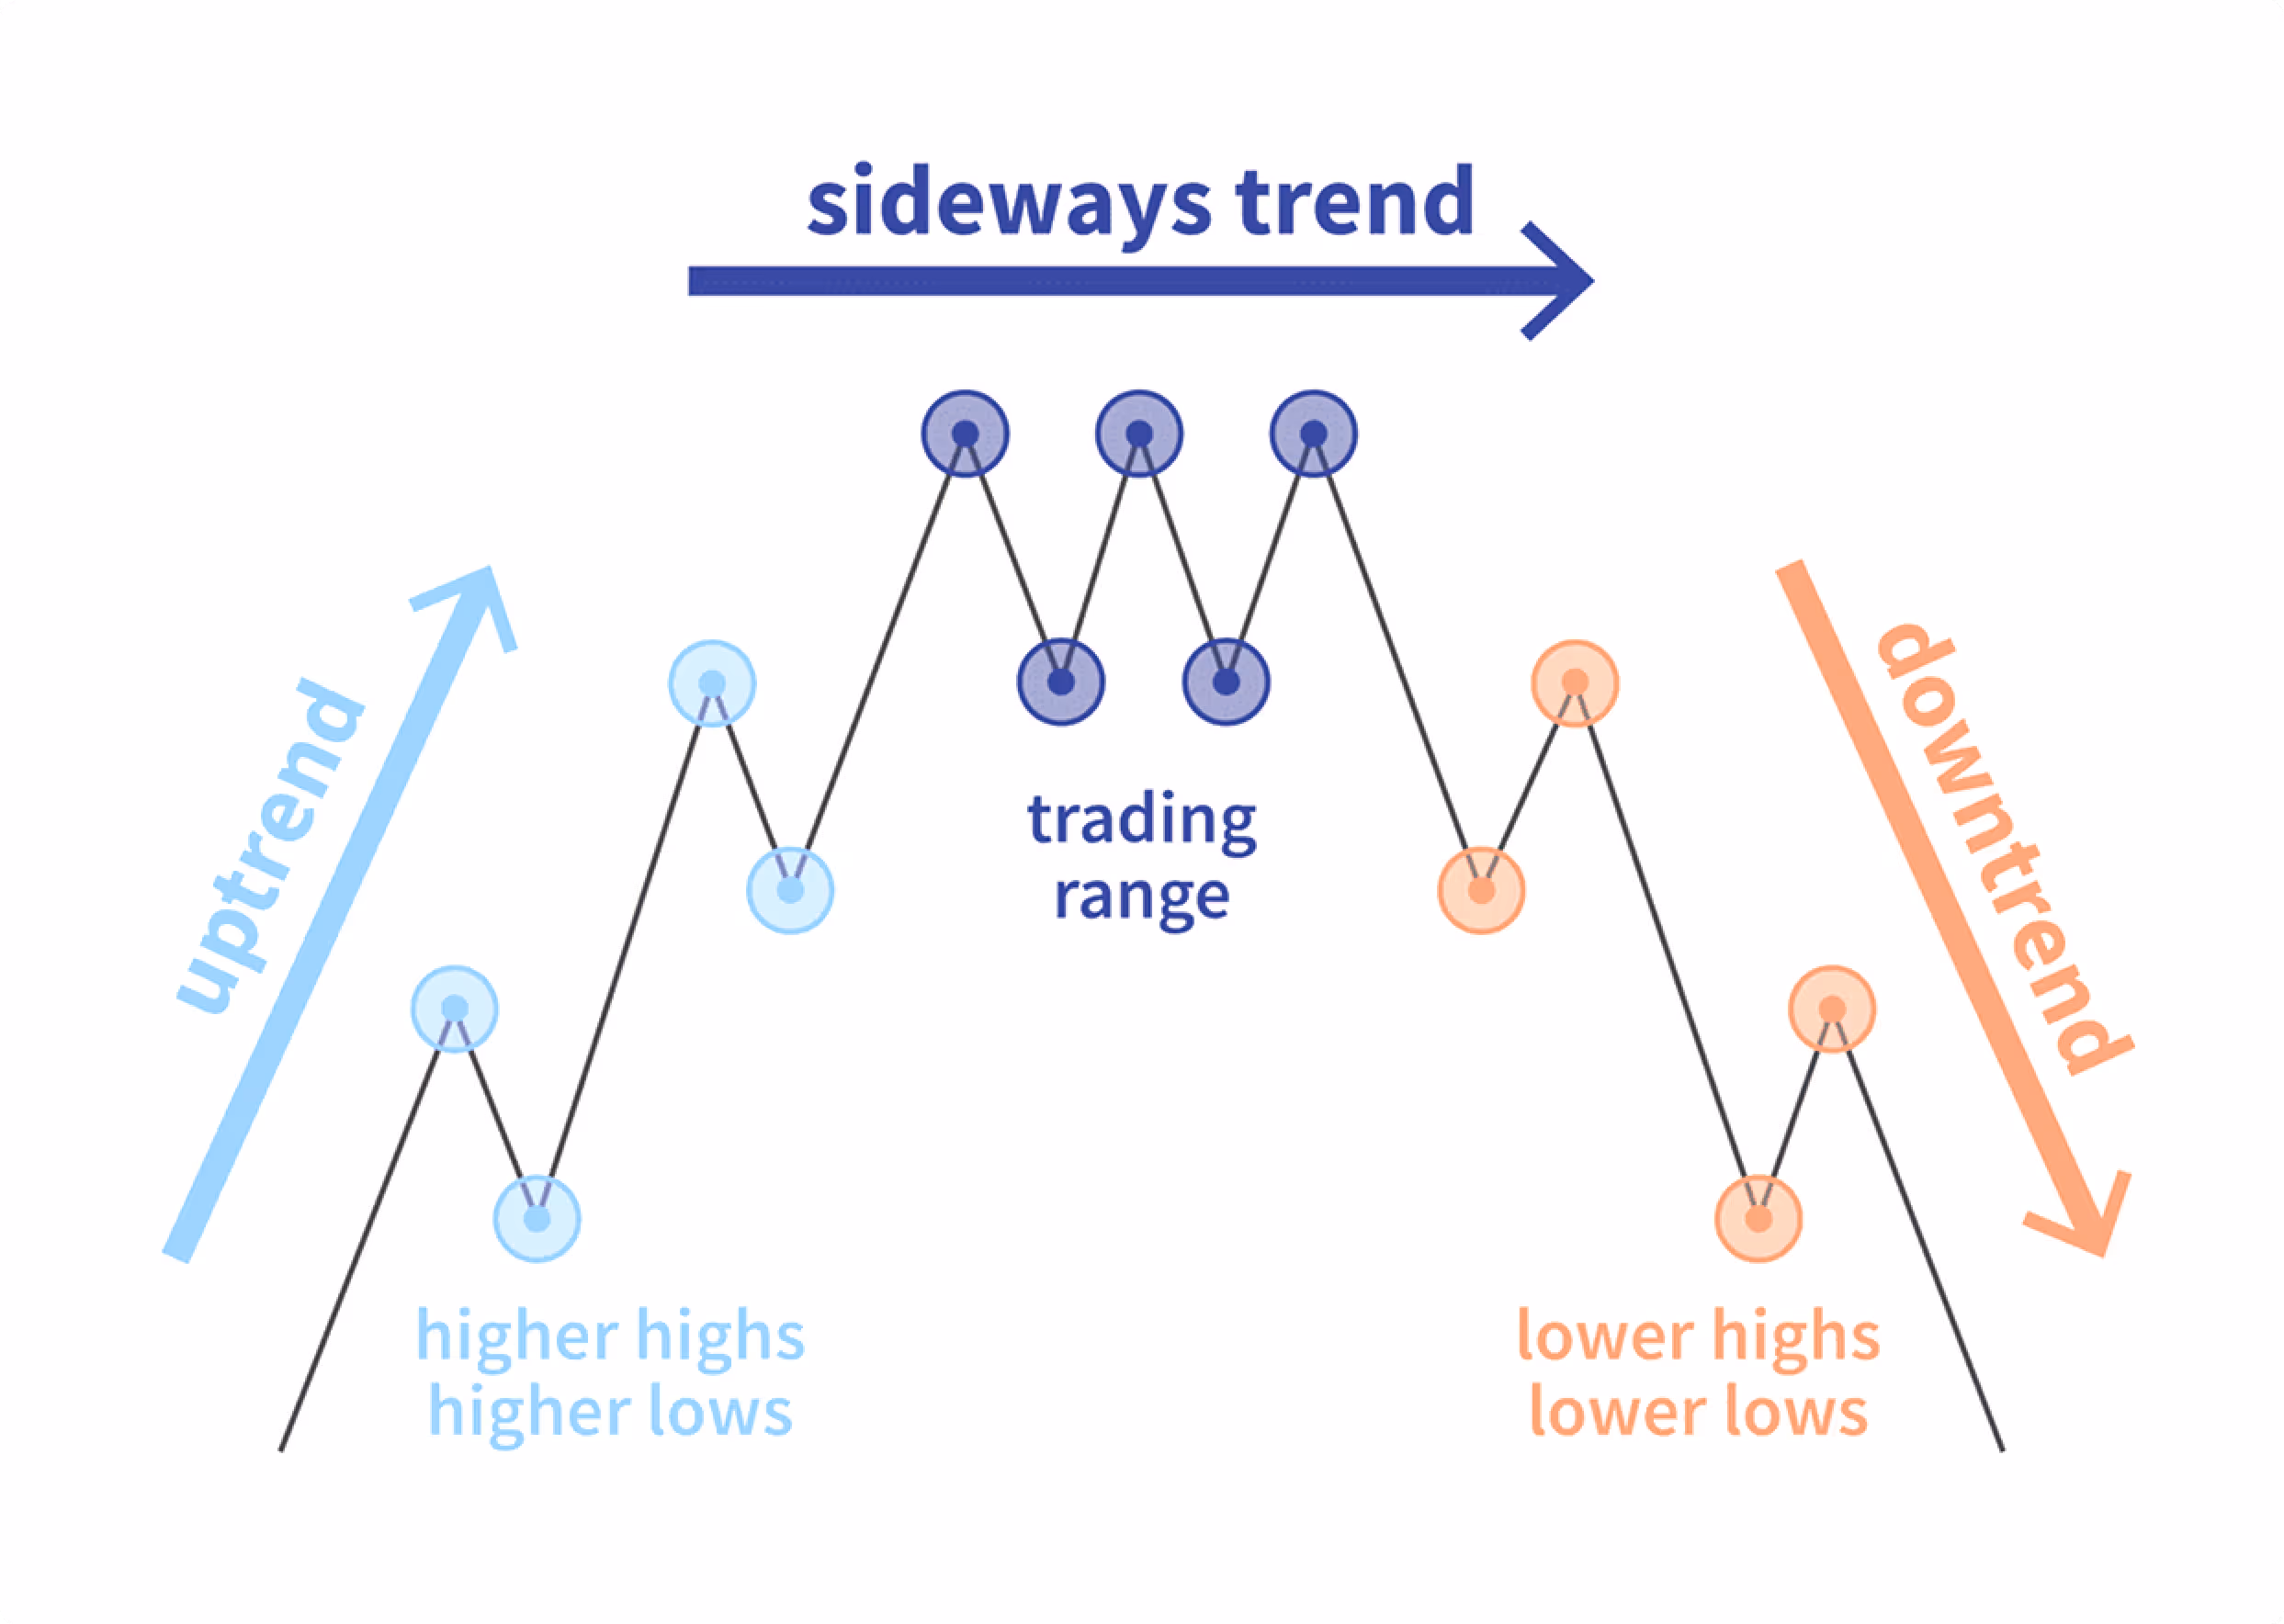
Trend-Following Indicators
These are broad indicators for where the market is headed in overall directions—up, down, sideways. These tools are designed to support traders in observing longer-term price trends and are often applied in strategies that seek to align with prevailing market direction rather than anticipating reversals.
A prime example is the Moving Average (MA), which smooths out short-term price fluctuations to help highlight broader directional trends.Another widely referenced tool is the MACD (Moving Average Convergence Divergence), which determines trend strength and direction through the crossover of moving averages.
These indicators are often applied during trending market conditions; however, they may produce less reliable signals in range-bound or volatile environments. For that reason, traders frequently use them in conjunction with other indicators or forms of analysis to support more comprehensive decision-making.
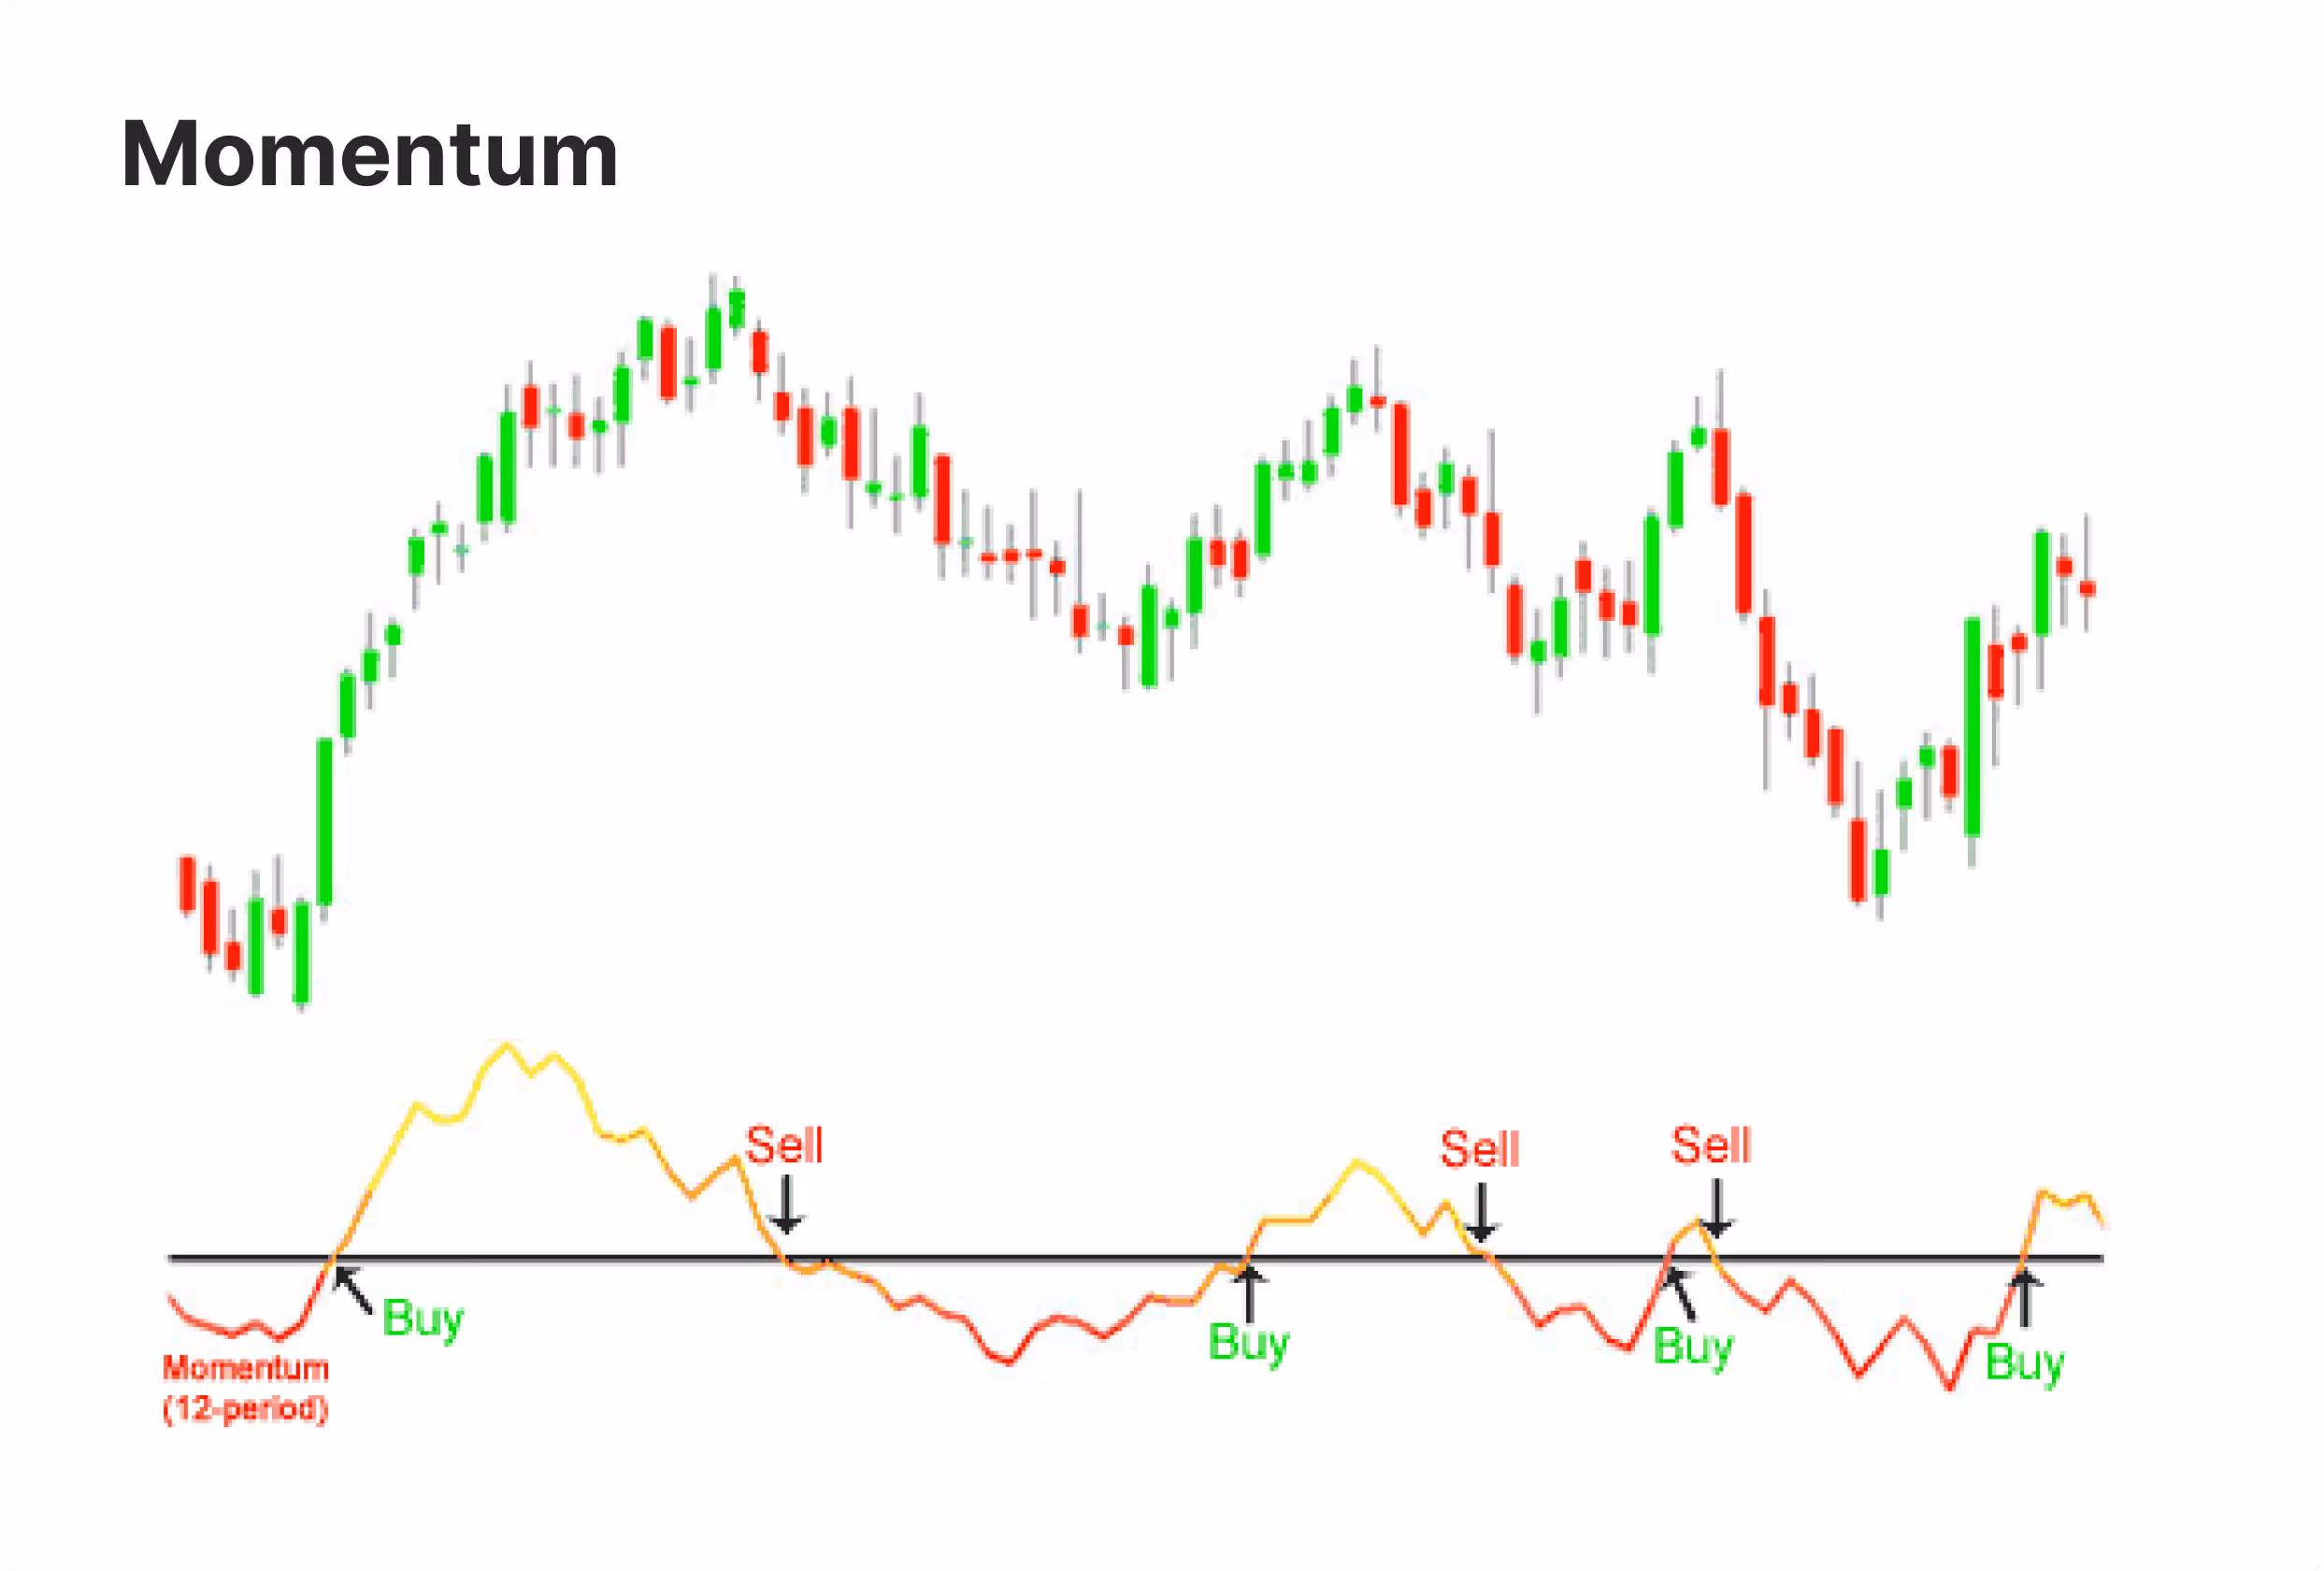
Momentum Indicators
Momentum indicators are technical analysis tools designed with the speed and power of price action in mind. They are commonly applied to help evaluate whether a current trend may be gaining or losing strength and is overdue for a possible reversal.
The Relative Strength Index (RSI), is one of the most widely used momentum indicators.lt operates on a scale of 0 to 100, helping to identify where a price may be possibly overbought or oversold.
Another popular indicator is the Stochastic Oscillator, a meter that indicates where a price is near a possible high or low point within its current range.
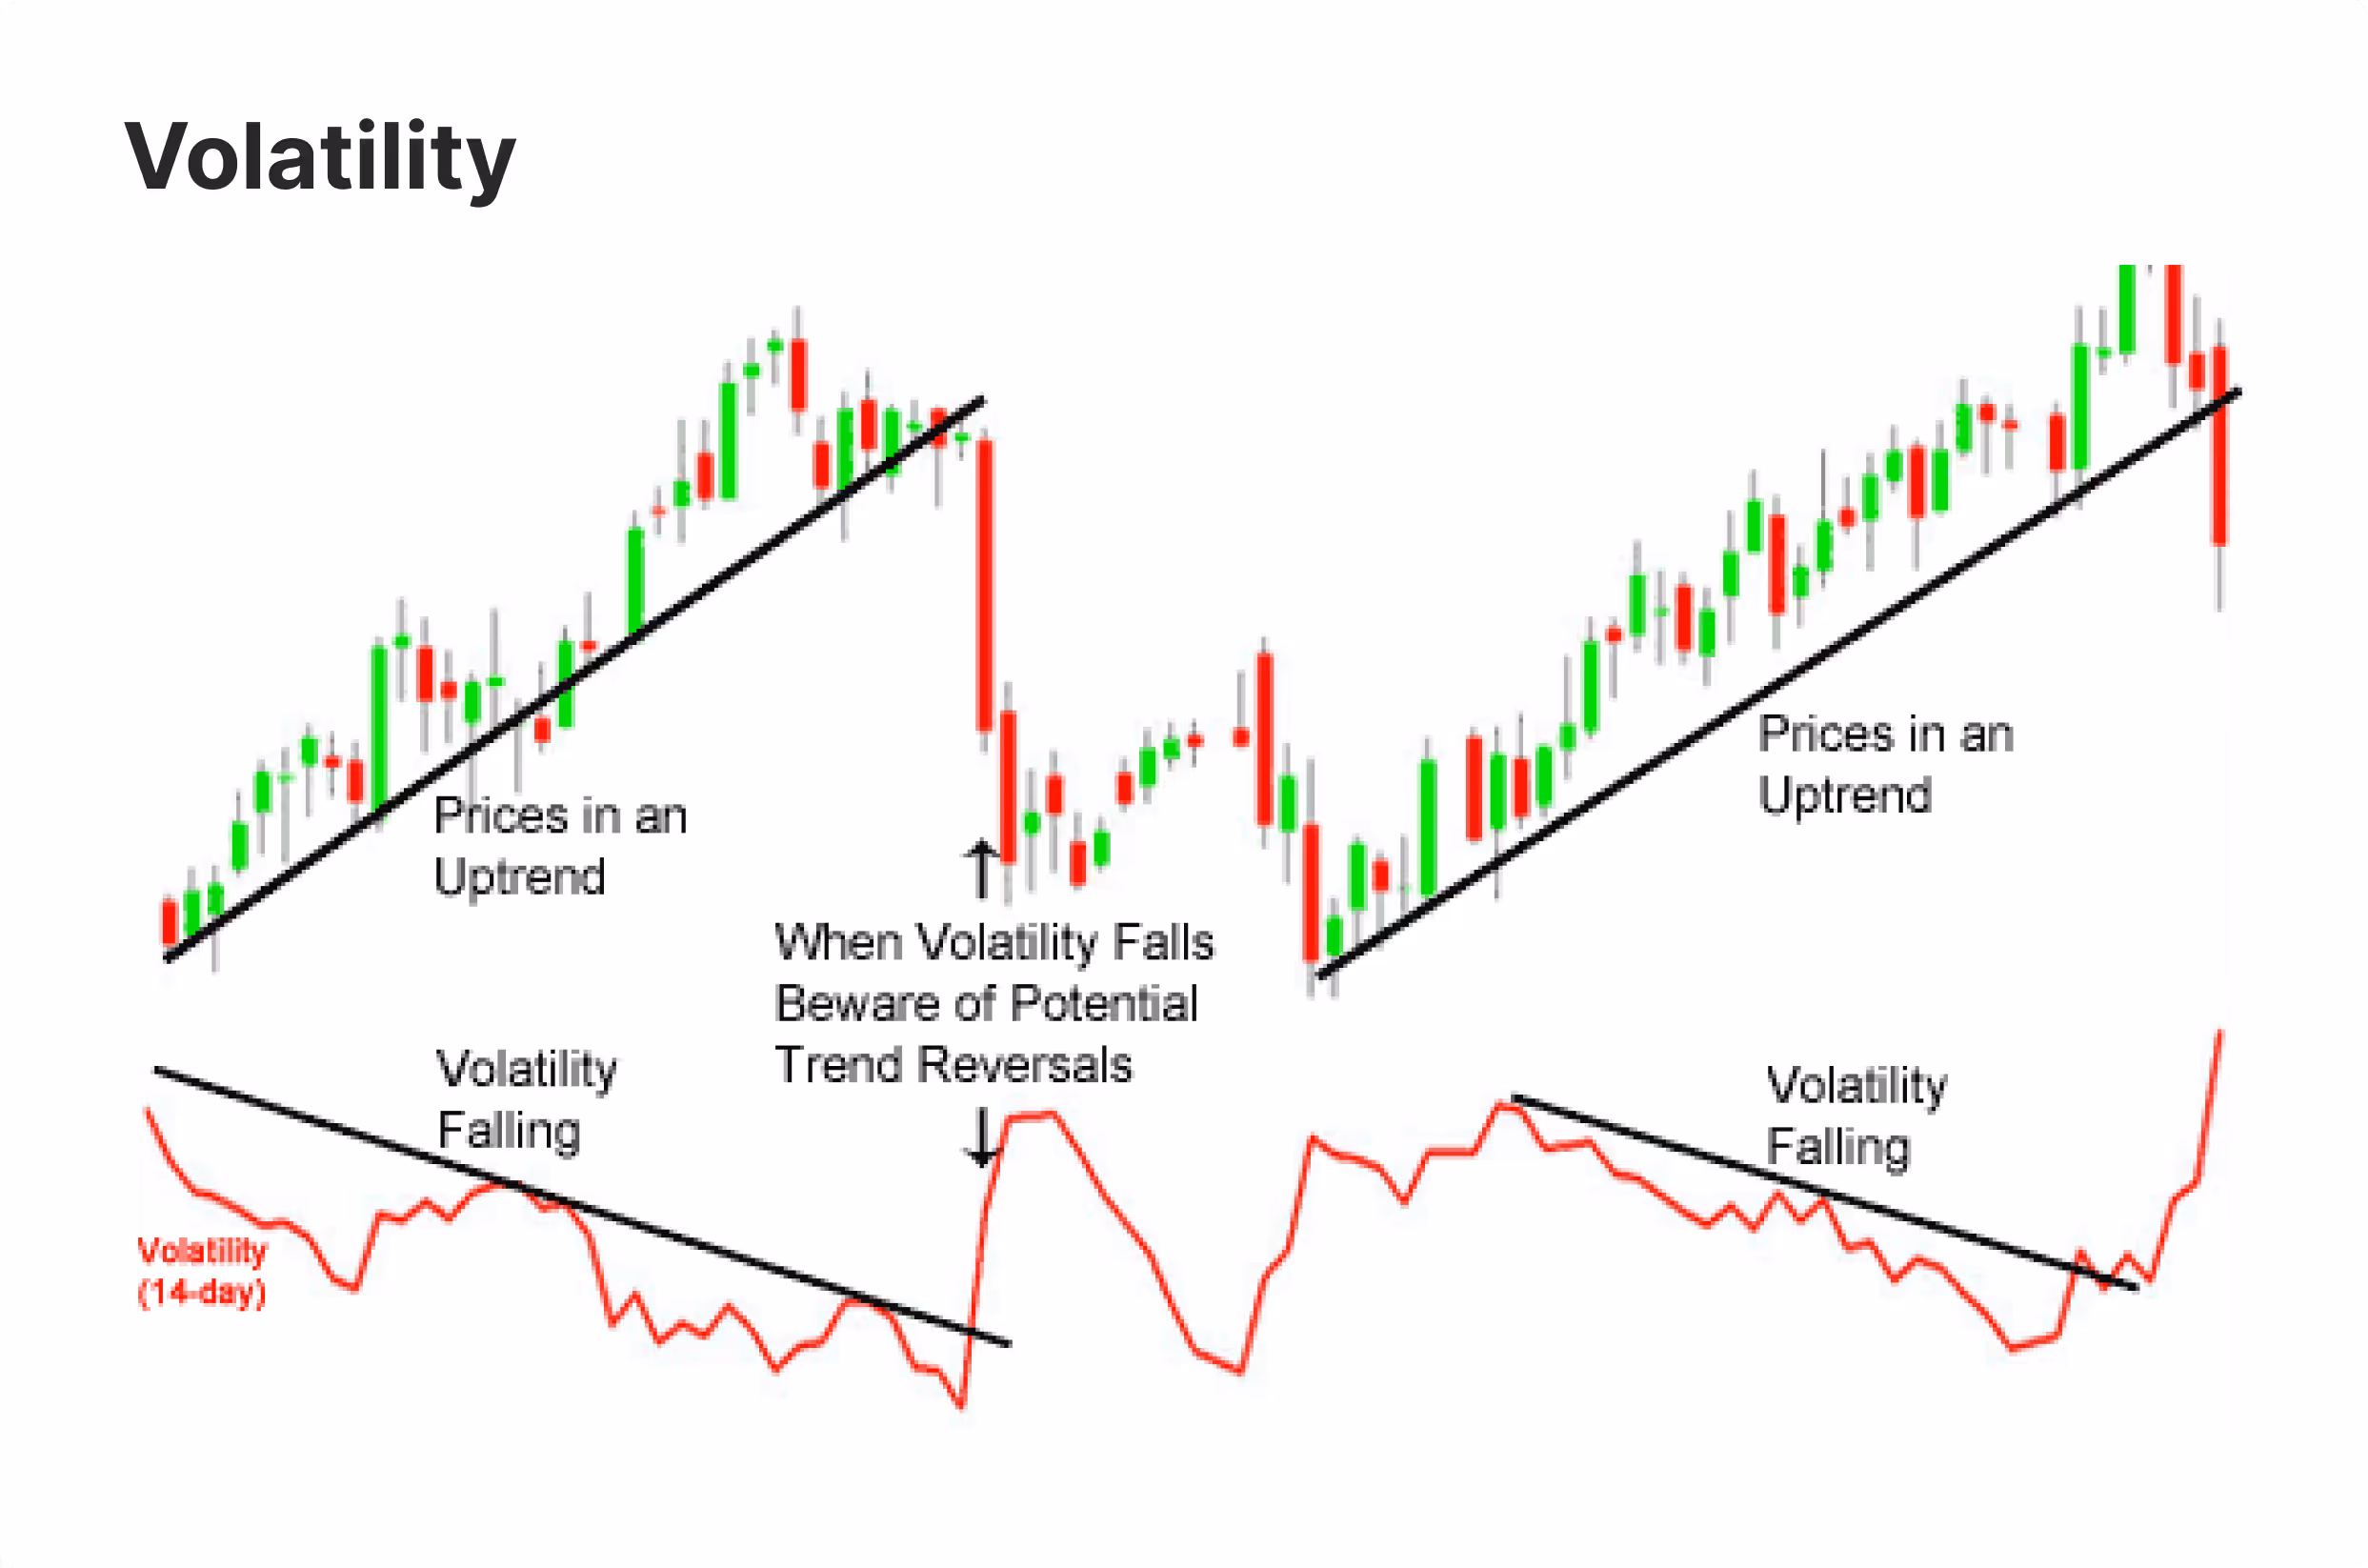
Volatility Indicators
Volatility metrics focus on the size of price movement—how quickly or randomly a currency pair is changing. Rather than predictive direction, volatility metrics offer market action levels and such tools are often referenced when assessing the potential for price breakouts or when exercising caution during unstable market conditions. Volatility indicators are typically used in combination with other forms of technical or fundamental analysis to support informed decision-making.
A classic case is Bollinger Bands. They expand when market volatility is high and narrow down when volatility is low, making it much clearer when the prices are pulled too far from the average.
Similarly, the Average True Range informs you how much the pair tends to move, something very informative when establishing the stop-loss level.
Volume-Based Indicators
While Forex doesn't provide centrally coordinated volume data like in stocks, tick volume—the number of price movements—can be a decent proxy to estimate trading activity.
Volume-based indicators aim to provide insight into the level of interest or participation behind a price movement. They are often used to help evaluate whether a trend may be supported by increased activity or if momentum may be weakening.. One commonly used tool is On-Balance Volume (OBV), which follows volume action in an attempt to forecast changes in relation to price movement.
Another is the Chaikin Money Flow, a combination of price and volume indicators that shows who, buyers or sellers, dominate. While less commonly applied in Forex than in equities, volume indicators can be useful second-level confirmation metrics.
Common Mistakes to Avoid in Forex Trading
Even with the well defined strategies and access to analytical tools you have at your fingertips, it is possible for traders to adopt habits or behaviours that may impact the effectiveness of their trading decisions. These challenges are particularly common among those new to the market and may not always be immediately apparent. In the next section are the three most common traps lying in ambush, and, importantly, how you can avoid falling for them.
Reliance on a Single Indicator
One of the biggest common pitfalls in trading is over-reliance on a single technical indicator. It's simple enough in your head to imagine you can come up with a single tool—RSI, perhaps, or MACD, or a moving average—that can be a clear-as-day buy/sell signal. Markets, though, are far too complex for something like that.
Each one has its strengths, and each one has its weaknesses. Some are sluggish in following price action, while others are too sensitive, giving false indications. You're buying with one eye closed, as it were, if you rely on just one.
A more structured approach is to combine a small number of indicators with different analytical strengths—for example, pairing a trend-following tool with a momentum oscillator. This can help provide additional context and reduce the likelihood of reacting to incomplete or misleading signals. However, even when using multiple indicators, no strategy eliminates risk, and all decisions should be supported by sound risk management.
Overplotting with Too Many Tools
On the other hand, others clutter their charts with too many indicators, trendlines, and overlays, to the extent that the decision-making process is hindered. This is a result of a fear of missing something important—a condition also referred to as "analysis paralysis".
Although more data leads to better decisions, in practice, it often results in confusion, indecision, and poor timing. Your charts are clear and purposeful. All the tools you use must play a clear role in your analysis. It doesn't add value or provide insight; it's nothing short of noise. It's not a weakness; simplicity is a sign of a mature mentality when it comes to trading.
Overlooking Fundamental Analysis and Risk Management
Over-dependence on technical indicators, neglecting consideration for the big picture, is also a misconception. Forex markets are controlled by macroeconomic fundamentals.
Shifts in interest rates, inflation announcements, geopolitical events, and actions by central banks can alter market direction, rendering an indicator unpredictable.
By skipping fundamentals, you risk unpredictable price movements. In much the same way, skipping proper risk management—such as entering a stop-loss, adequately sizing positions, or understanding your leverage—can turn a slight misstep into a costly catastrophe.
A technologically correct setup doesn't matter when you're overexposed or blindsided by a massive news release. Successful speculation includes a combination of proper technical analysis, a good understanding of the overall economic landscape, and disciplined risk management. It's a three-legged stool—the entire thing collapses when you remove any one.
Conclusion
There’s no magic formula in Forex—but there are tools that can support a more structured and informed approach. From smoothing trends with moving averages to spotting momentum with RSI or anticipating breakouts with Bollinger Bands, the very popular Forex indicators covered here offer practical insight to traders at all levels.
Used wisely—and always alongside sound risk management, an understanding of fundamentals, and a secure Forex broker—they can help you make better-informed, more confident trades. Remember: the key isn’t to predict the market perfectly, but to read it well enough to act with purpose.
[[aa-faq]]
FAQ
What’s the most beginner-friendly Forex indicator?
Many traders consider Moving Averages a suitable starting point due to their straightforward structure and visual clarity. They are commonly used to help identify general price trends over time and are often included in basic trading strategies. While easy to interpret, it's important for beginners to understand that no indicator can predict market movements, and trading decisions should always be made within a well-considered risk management framework.
Can I trade with just one indicator?
While it is technically possible to base trading decisions on a single indicator, doing so may limit the depth of analysis. Many traders choose to combine multiple indicators such as trend-following and momentum tools to gain a broader perspective and help validate signals. However, no combination of indicators can guarantee accuracy, and all trading decisions should be supported by sound risk management and a well-defined strategy.
Are Forex indicators effective for short-term trades?
Certain technical indicators, such as the Relative Strength Index (RSI) and Stochastic Oscillator, are frequently used in short-term trading strategies to observe momentum and potential shifts in market conditions. While these tools can support analysis on shorter timeframes, they do not provide predictive signals and should be used alongside other risk management measures and analytical methods.
Do indicators work during news events?
Technical indicators may be less effective during high-impact news events, as increased volatility can lead to rapid price movements that exceed typical patterns. In such conditions, indicators may lag or generate signals that do not reflect the underlying market drivers. Traders often exercise additional caution during these periods and may choose to complement technical analysis with an understanding of relevant fundamental factors.
Connect with Our Experts
Our team is equipped to provide solutions precisely to your requirements. Let's explore your options and discuss how we can support your objectives


.svg)


%2C.avif)