In modern economic markets, phrases like "dead cat bounce" capture the attention of those who actively participate in financial life. For them, a deep understanding of this market phenomenon is critical to overcome the complexities of a bear market.
This article explains the meaning of a dead cat bounce, its characteristics, and strategies for effectively trading it.
[[aa-key-takeaways]]
[[/a]]
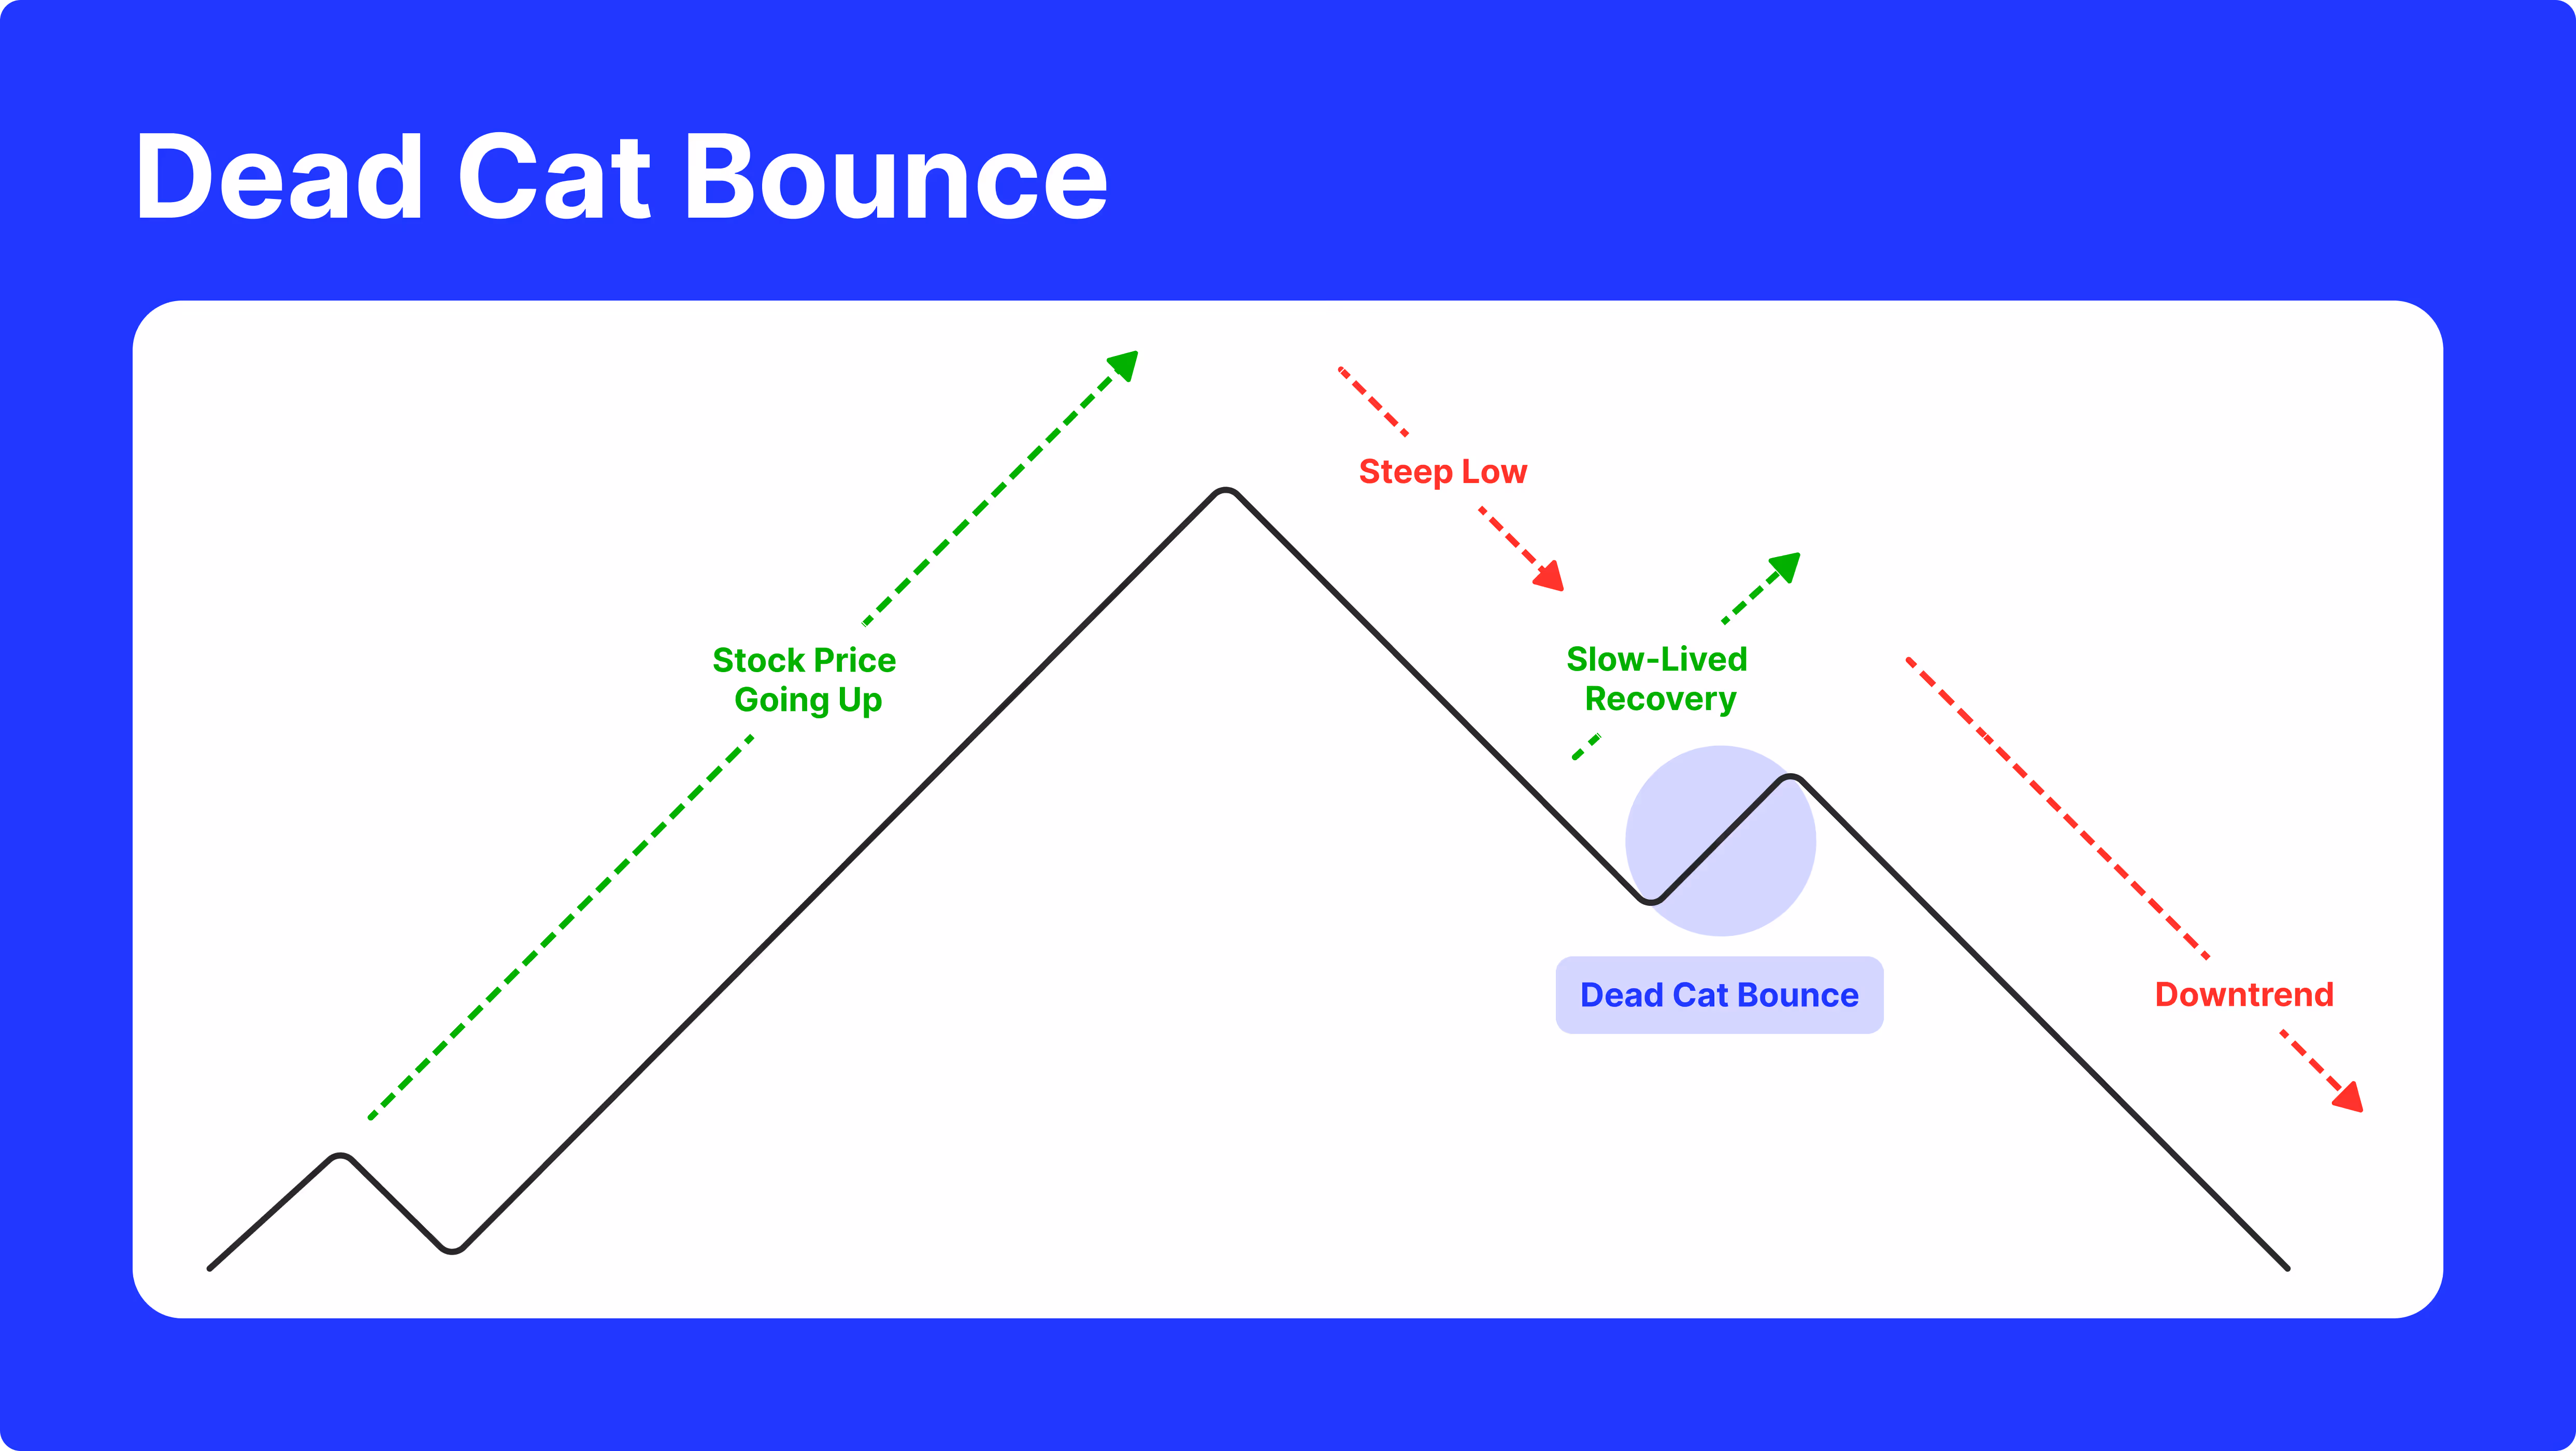
A short-lived recovery in a particular stock price following a notable downtrend is a dead cat bounce. This bounce can create a wrong impression that the downtrend is reversing, prompting some investors to buy in hopes of a sustained recovery.
However, the bounce is often an outcome of short-term factors, such as technical rebounds, short-covering, or temporary market sentiment shifts, rather than a real change in the health of the asset or stock market.
This pattern is commonly observed in various assets, including stocks and ETFs, and is often identified through technical analysis on daily charts.
Raymond DeVoe Jr., a Wall Street analyst, is credited with coining the term "dead cat bounce." The term has been used in financial markets for several decades and has become a common lexicon among traders and investors.
The metaphor - "even a dead cat will bounce if dropped from a height" - effectively captures the phenomenon's essence – a temporary and misleading rebound in the price of a declining asset.

Recognising a dead cat bounce needs a thorough analysis of price motions and various technical indicators. While there's no foolproof method, several traits and patterns may suggest that a bounce is likely to be short-lived:

Remember that no single indicator or trait can definitively predict stock price activities, and trading always contains risks. Using these signals simultaneously with a comprehensive trading strategy and risk management plan is essential. Additionally, staying updated about market news and happenings that could impact the asset is essential for a well-rounded analysis.
While dead cat bounce can occur across different time frames, they are often short-lived. Rallies lasting from three to 15 days are typical, but variations exist. Some bounces may signal a potential reversal, emphasising the importance of monitoring each bounce individually.
Traders employ various strategic approaches to maximise gains from dead cat bounce; each personalised to fit stock market dynamics.
One such technique is the Bollinger Band Strategy, where traders seize the opportunity by entering short positions as the price ascends to the upper Bollinger Band and subsequently repeats. This method controls the volatility indicators of the Bollinger Bands, allowing traders to capitalise on the temporary growth before an anticipated decline.

Another widely used approach involves the MACD Crossover, a method that activates short positions when the MACD line crosses below the signal line from above. This crossover signals a potential reversal and serves as a signal for traders to capitalise on the downturn.
By relying on the MACD, traders gain insights into momentum shifts, enabling them to make informed decisions during dead cat bounce.

The Price Action Strategy constitutes another effective tactic, emphasising the importance of monitoring price movements. Traders employing this strategy enter short positions when the price descends below a prior swing low, a critical threshold that indicates a resumption of the prevailing downtrend.
This method aligns with the philosophy that historical price movements can provide valuable insights into future trends, allowing traders to position themselves strategically during dead cat bounce.

Amidst these strategic manoeuvres, risk management arises as a cornerstone for traders. Implementing stop-loss orders is paramount, acting as a safeguard against unexpected market movements that could lead to substantial losses.
Additionally, adept management of position sizes is crucial, ensuring that potential losses are controlled and do not excessively impact overall portfolio performance.
Distinguishing between a dead cat bounce and a market reversal is critical for traders and investors. Key differences include the duration and magnitude of the rally.

A dead cat bounce is characterised by its briefness, lasting three to 15 price bars. A prolonged rally exceeding 20 days may indicate a potential reversal. Additionally, the magnitude of the upward move, surpassing prior swing highs, can signal a reversal.
Traders use various technical and basic analytical tools to differentiate between these two scenarios, such as trendlines, moving averages, volume analysis, and trend reversal indicators. By studying these concepts, market participants can make more informed conclusions based on the specific dynamics.

While both a bead cat bounce and a bull trap involve temporary price changes that may mislead traders, they occur in different market conditions. A dead cat bounce happens in a downtrend and tempts investors to believe in a trend reversal, while a bull trap appears in an uptrend and tricks traders into thinking a bullish trend will persist when it actually reverses.
Both phenomena highlight the importance of careful analysis and risk control in trading to avoid falling into possible traps and making instructed judgments based on the underlying market dynamics.
Examining historical instances makes the pattern of dead cat bounce more understandable. For example, Cisco Systems experienced multiple dead cat bounces during the dot-com collapse. More recently, the market's response to the onset of the COVID-19 pandemic showcased a classic dead cat bounce, with an initial rally followed by a substantial downturn.
Cryptocurrency markets, known for their unregulated and speculative nature, have also seen dead cat bounce. In late 2017, Bitcoin hit an all-time high of $20,000 during the ICO bubble. After the bubble burst, Bitcoin's value dropped from $20,000 to about $3,000, displaying multiple dead cat bounces in its descent.
It's essential to note that a dead cat bounce results from a declining trend, not the other way around. Such bounces don't always indicate gloom; sometimes, resolving issues in the prevailing downward trend can push the asset back into a bullish market.
[[aa-fast-fact]]
A dead cat bounce in investing is a "loser's rally." It can entice investors to put money into a troubled company.
[[/a]]
Serving as a price pattern, dead cat bounce is frequently examined by technical analysts when assessing a market. Its characteristic unpredictability poses a significant challenge for even the most experienced investors.
The dead cat bounce cannot be predicted because it doesn't follow an obvious pattern. This issue primarily arises from speculative market activities and trading behaviour, often leading to confusion.
In the world of finance, realising the complexities of a dead cat bounce is a valuable skill. Traders and investors equipped with the knowledge of this pattern can navigate bear markets more effectively, employing strategies tailored to capitalise on short-lived rallies while managing risks.
Stay vigilant, stay informed, and let the dead cat bounce be an alarming sign rather than a trap.