


Trading in financial markets can be challenging in the light of multiple trading markets, instruments, assets, and orders that can be executed to make some gains. Also, after analysing the above, success is not guaranteed in the financial market. Most traders try to mitigate the risks and maximise the chances of hitting the jackpot using technical indicators and analysis to look at the market trends differently.
Technical indicators help paint a bigger picture of what is happening in the market and spot the light on underlying meanings behind a particular price action. Ensure you read until the end of this article and find a cheat sheet to excel at technical analysis.
[[aa-key-takeaways]]
[[/a]]
Indicators are technical tools provided in the trading platform, including signals, technical analysis, and options you can apply to a trading chart.
Most platforms offer a plethora of trading indicators that you drag and drop on the trading charts to explore different readings of the price trend and direction. Beginner traders may find it intimidating because there are many indicators, and not all apply to every asset.
Different technical indicators depend on your trading strategy, style, and industry. Some indicators are more risk tolerant than others, which can be applied to more volatile markets like cryptocurrencies, while other technical indicators are well-suited for long-term investments.
Financial markets involve a complex structure and several dependencies and variables, and a single glimpse at the price chart patterns may not tell everything the trader needs to know.
Therefore, trading indicators and tools help traders understand the full picture, track previous price tendencies, and reasonably predict future price movements.
For example, the price of asset A may face a sudden price increase, higher than that last 15 days average. A trader may think it is time to buy and capitalise on the increasing asset price.
However, a technical indicator may show that this price increase is an outlier movement due to overbuying, and the price will soon return to the average price, meaning that buying now is not the best move.

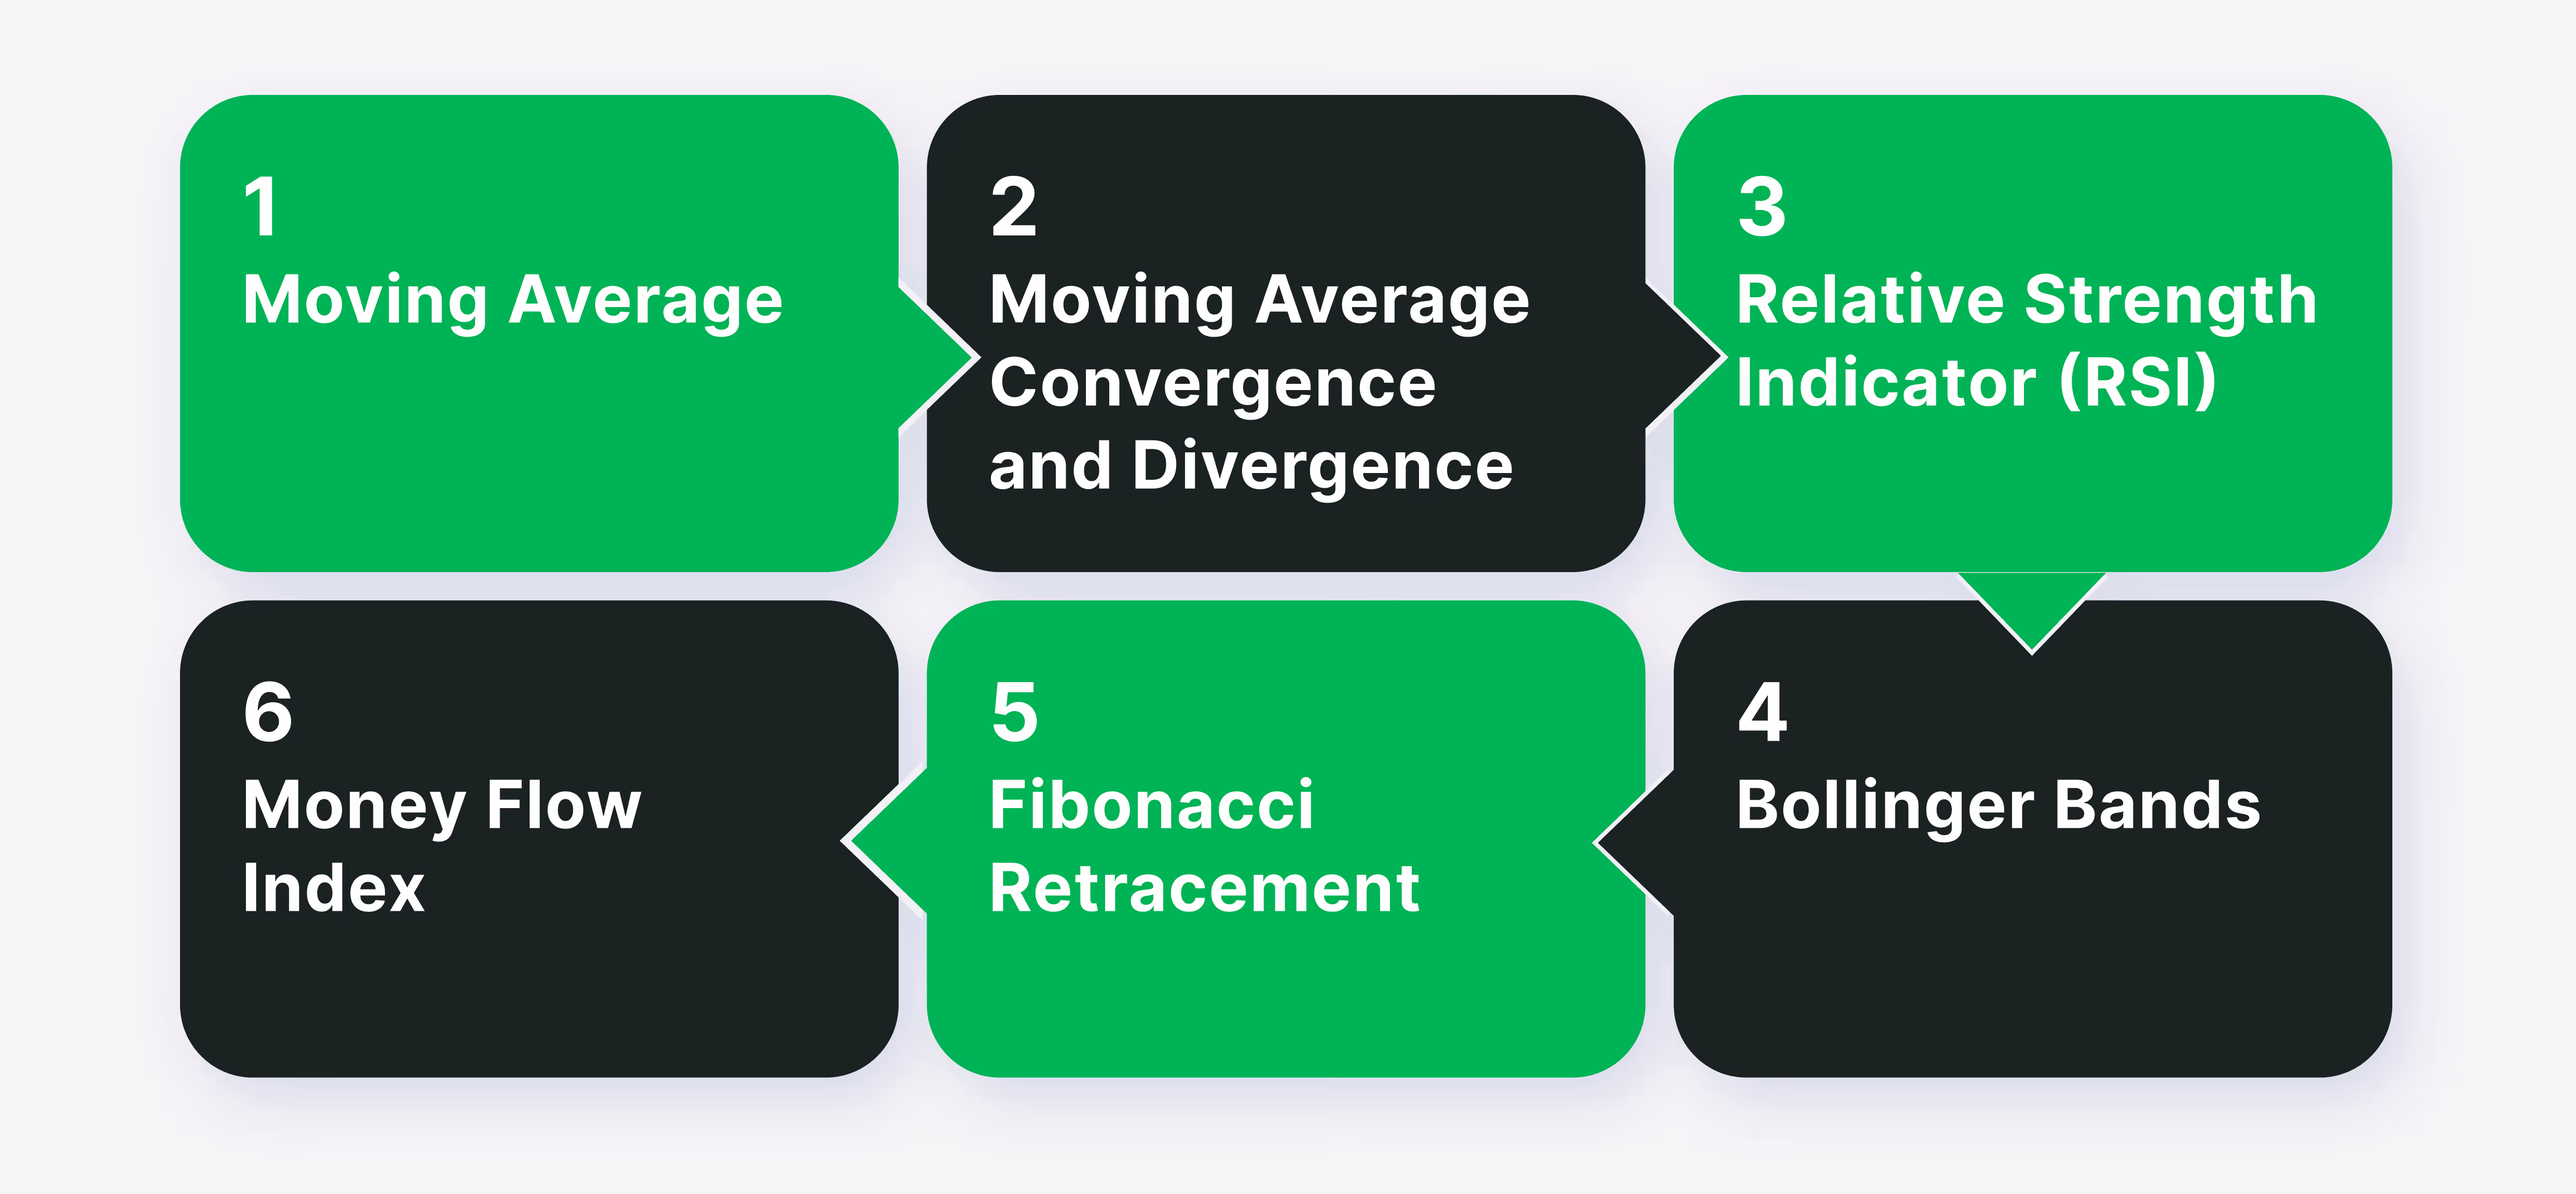
Technical indicators are usually shown in the options tab on the trading platform, and you may find different indicators between the platforms. However, here’s a cheat sheet of the most popular technical indicators you can use with your trading strategies.
The moving averages are a commonly used technical indicator due to their simplicity and the useful technical analysis they provide. Moving averages use a price line of an asset’s previous price averages over a period of time.

This technical analysis helps traders identify market trends and to better respond to market sentiment. Most traders use the moving averages through Simple Moving Averages and Exponential Moving Averages.
Using this technical analysis, if the price increases and crosses above its MA line, it refers to a possible price increase. On the other hand, if the price drops below the MA line, it indicates a possible downward trend.
[[aa-fast-fact]]
MetaTrader 4 is one the most used trading platforms and hosts more than 2,000 technical and custom indicators.
[[/a]]
The Moving Average Convergence Divergence is a momentum indicator that helps traders identify future price movements to capitalise on accelerated price changes. The MACD works well with trend trading strategy, where traders follow and act on market trends.
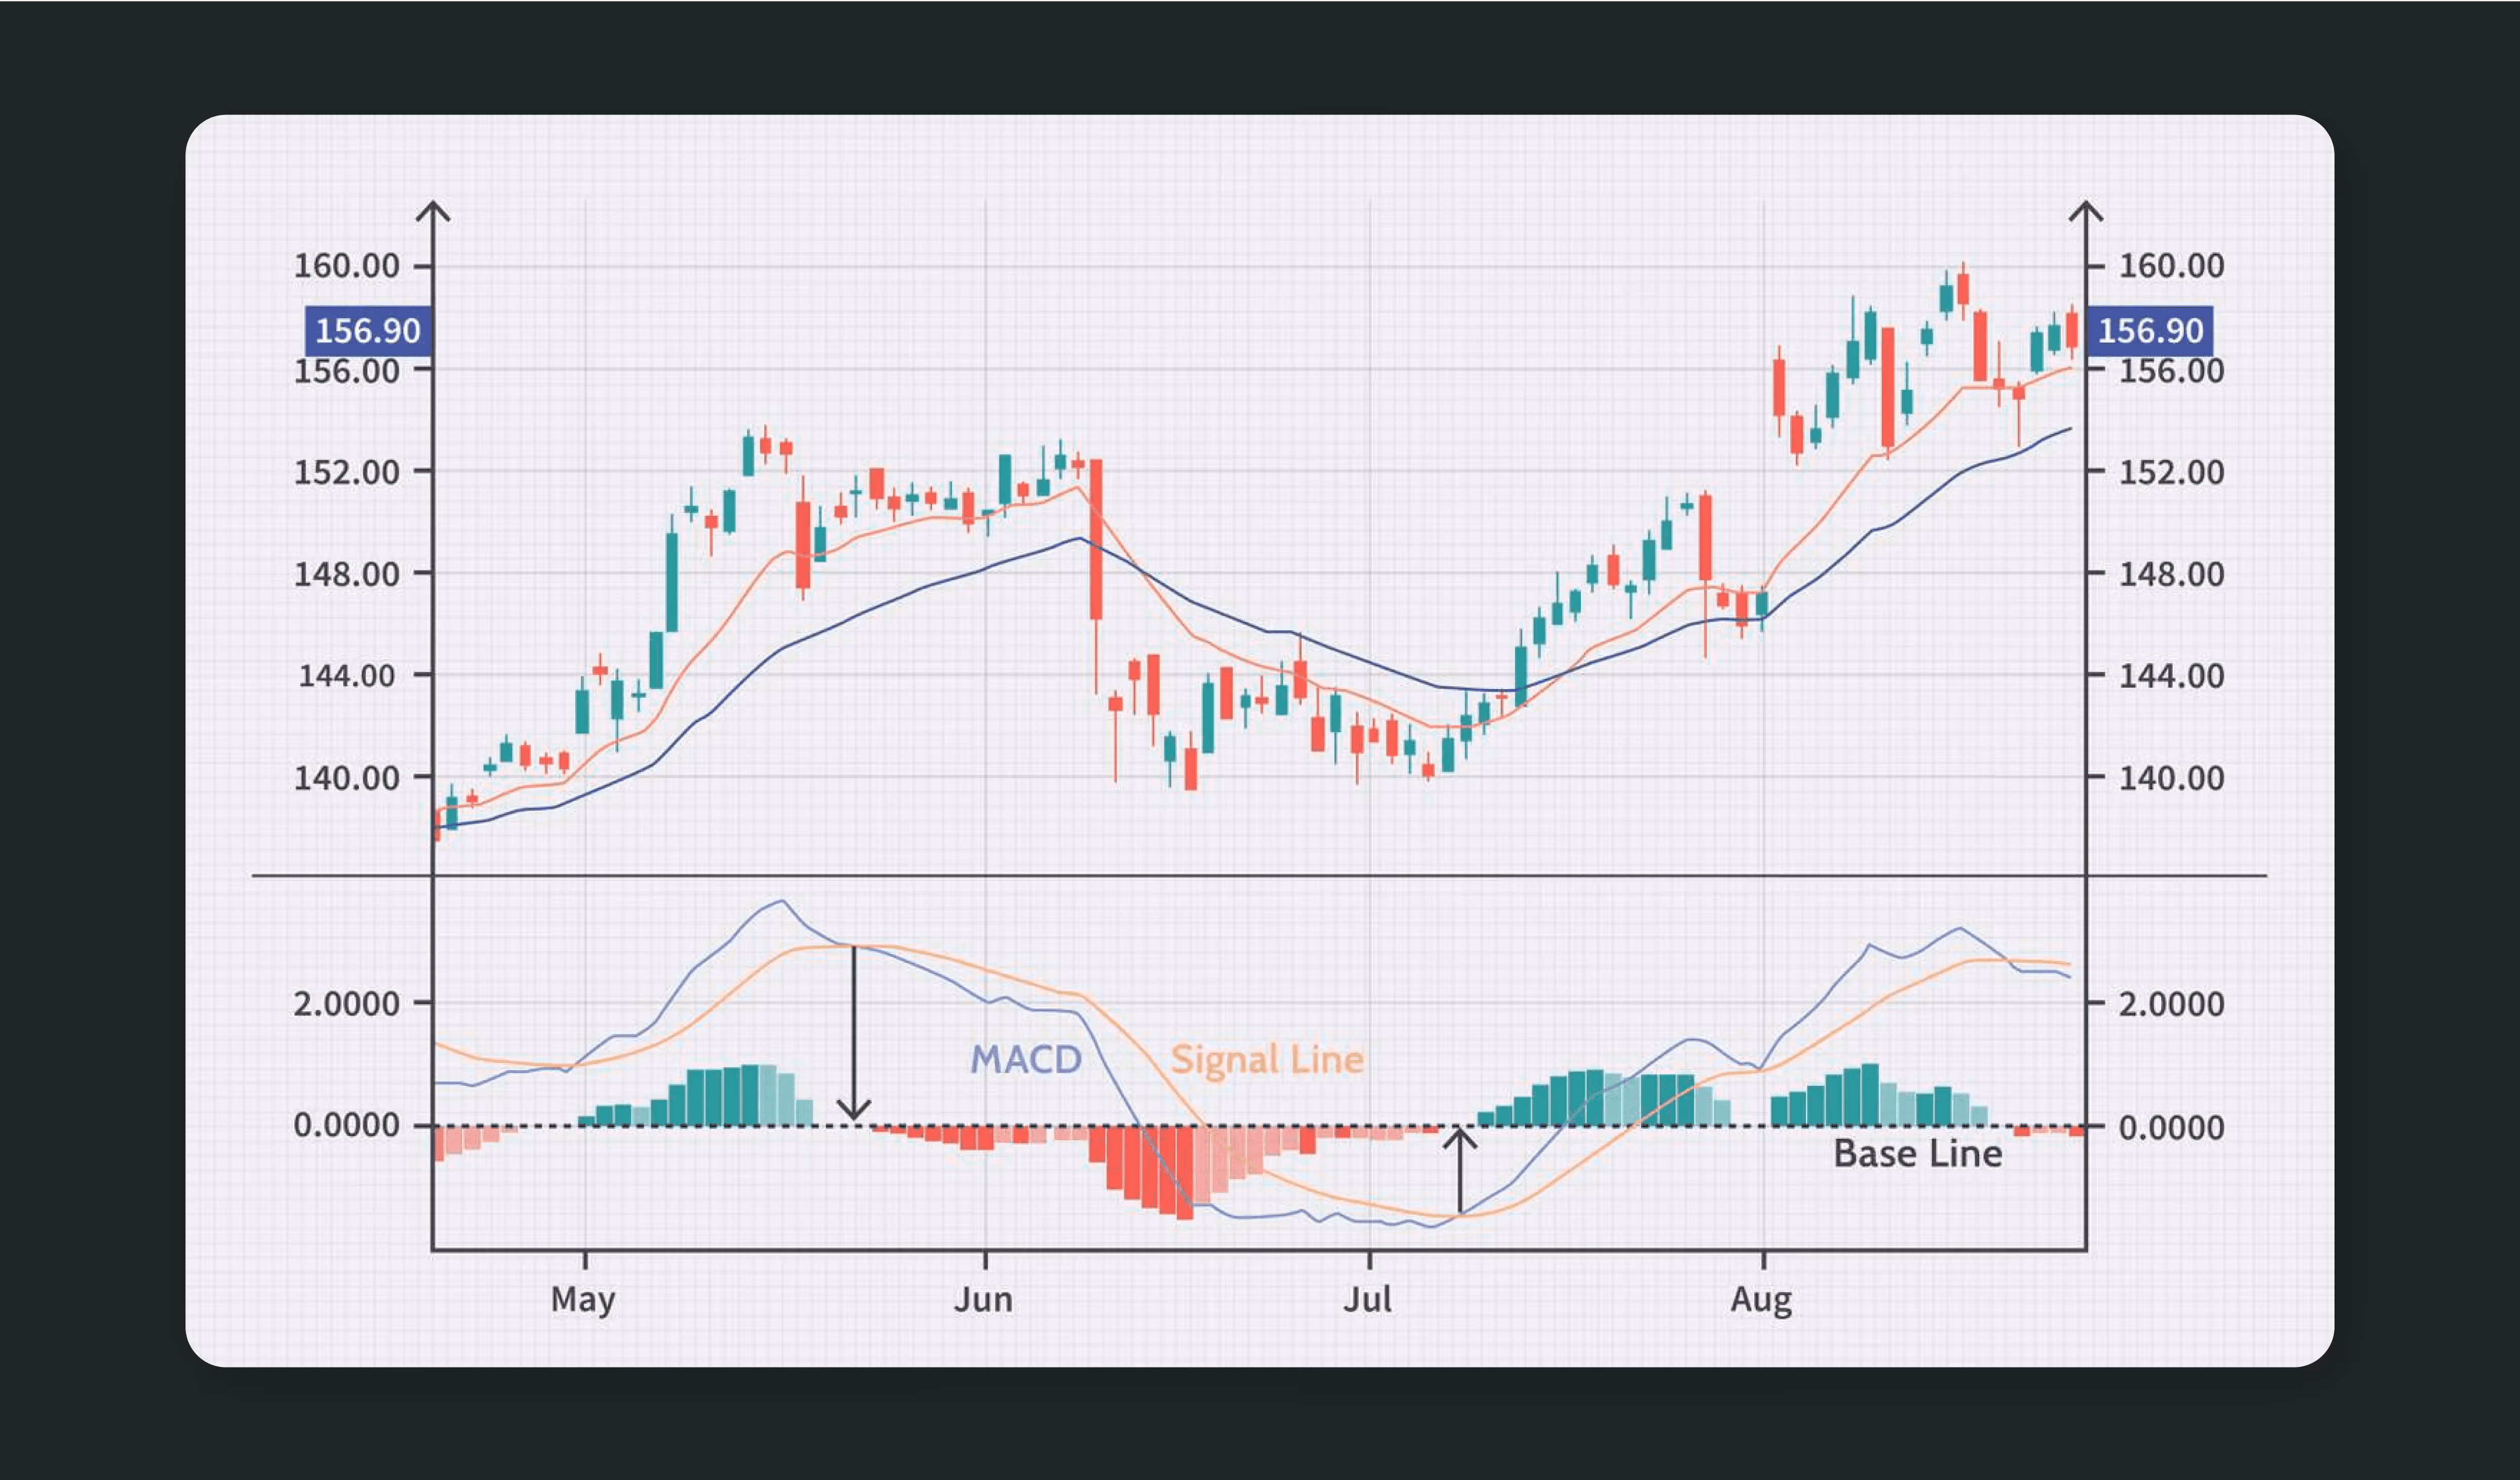
The MACD indicator is derivative from the moving averages technical indicators, using EMA as a baseline. MACD works by subtracting EMA-26 from EMA-12 as a fast line on the one hand.
On the other hand, the fast line is combined with a slow line, which is the EMA-9 line. This technical analysis compares the fast line “MACD line” against the slow line “signal line” to find market sentiment.
When the MACD line drops below the signal line, it indicates a downward trend; when the MACD price breaks over the signal line, it indicates an upward trend.
The RSI is another momentum indicator that reveals a price trend's strength by using average price losses and gains over historical periods. This technical analysis indicator displays the results and gives a score ranging from 0 to 100.

Bollinger Bands are volatility indicators that assist traders in identifying volatility levels and determining entry and exit points. BB technical indicators use three lines or bands: an upper band, a lower band, and a middle band, that is, the SMA line.

The upper and lower bands expand and shrink, simulating market volatility, while the SMA line dictates if an asset is overbought or oversold. If the middle line moves close to the upper bands, the asset is overbought, and vice versa.
This technical indicator measures price momentum by calculating an asset closing price and comparing it to historical price averages over a certain period of time.
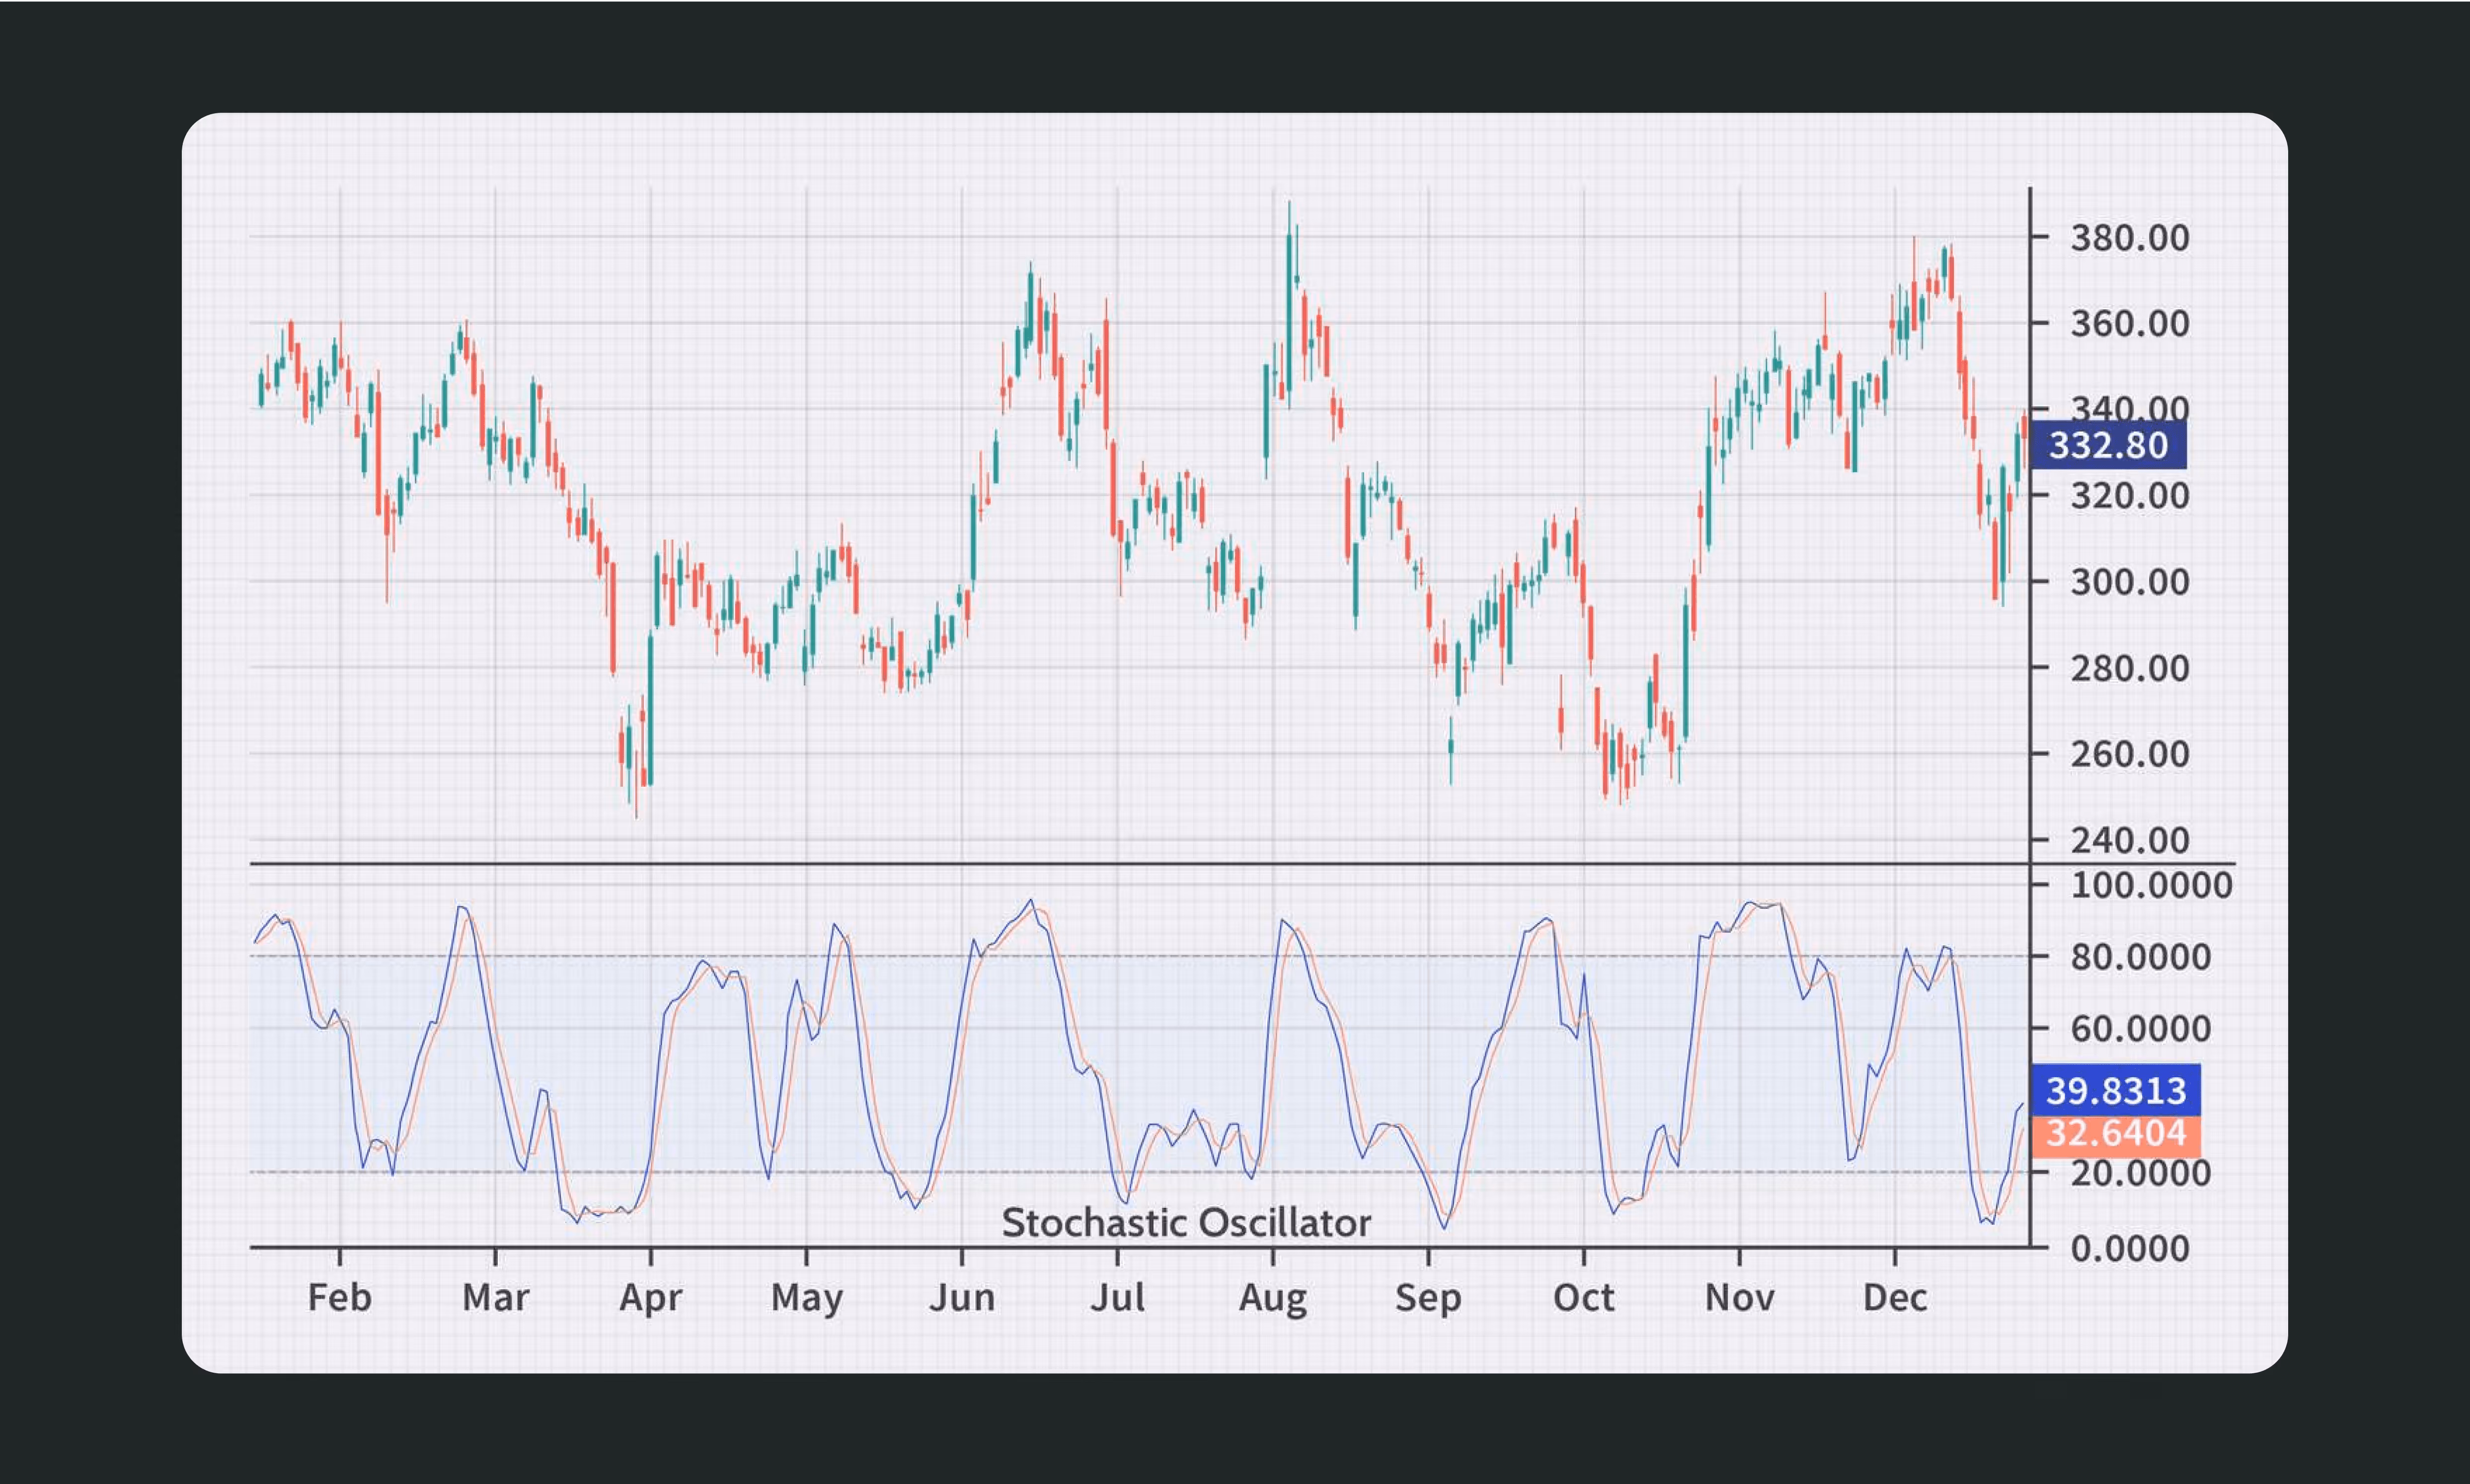
The Stochastic Oscillator technical analysis gives a score ranging from 0 to 100, indicating how strong is a given price trend.
Ichimoku Cloud is like multiple indicators in one tool because it helps traders determine market trends, momentum, entry and exit points, and more.

This technical analysis draws a shaded cloud on the trading chart, indicating support and resistance levels, current price action, and if a potential trend reversal is expected.
This indicator works for different trading strategies because it powers various technical analysis tools that suit different markets.
Technical indicators are tools and signals that help traders better read chart patterns and understand price movements, which can be combined with different trading strategies. Multiple indicators are used to measure volatility, while others analyse momentum and how strong is the current price movement.
Applying technical indicators will assist you in market forecasting and making informed decisions to increase your chances of success.


