What is a Doji Candle Pattern, and How Can You Use it?
 By Constantine Belov
As a hard-working, goal-oriented, and well-rounded person, I always strive to do quality work for every job I do. Faced with challenging tasks in life, I have developed the habit of thinking rationally and creatively to solve problems, which not only helps me develop as a person, but also as a professional.
Speaking about my professional activities, I can say that I have always been attracted to the study of foreign languages, which later led me to the study of translation and linguistics. Having great experience as a translator in Russian, English and Spanish, as well as good knowledge in marketing and economy, I successfully mastered the art of copywriting, which became a solid foundation for writing articles in the spheres of Fintech, Financial markets and crypto.
 By Tamta Suladze
Tamta is a content writer based in Georgia with five years of experience covering global financial and crypto markets for news outlets, blockchain companies, and crypto businesses. With a background in higher education and a personal interest in crypto investing, she specializes in breaking down complex concepts into easy-to-understand information for new crypto investors. Tamta's writing is both professional and relatable, ensuring her readers gain valuable insight and knowledge.

Today, engaging in capital market trading is fundamentally linked to technical analysis. This approach facilitates a comprehensive evaluation of market sentiment and uncovers trends in both absolute and relative price movement indicators for specific assets over defined time intervals.
At the same time, the existing uncertainty in the market, which causes an imbalance between supply and demand for a particular asset, forms a candle formation with a missing body when analysing the chart, which demonstrates strong fluctuations and doubts among market participants. This formation is called the doji candle pattern.
This article will explain what a doji candle pattern is, what types of candle patterns exist and what market patterns it displays.
A doji candle pattern represents indecision between buyers and sellers, where the opening and closing prices are nearly identical, signalling a potential reversal or continuation of the trend.
When a doji appears after a prolonged uptrend or downtrend, it often signals a weakening of momentum and can act as a precursor to a trend reversal, but confirmation from other indicators is necessary.
Doji patterns are most effective when used alongside technical tools, such as moving averages or volume analysis, to validate market moves and help traders make deliberate decisions.
A doji candle is a specific type of candlestick pattern used in technical analysis to represent market indecision. It occurs when an asset's opening and closing prices are nearly identical, resulting in a candle with a very small or non-existent body. This means that the price fluctuated throughout the trading period (whether it's a day, hour, or minute, depending on the chart) but ultimately returned to close at or very near the opening price.
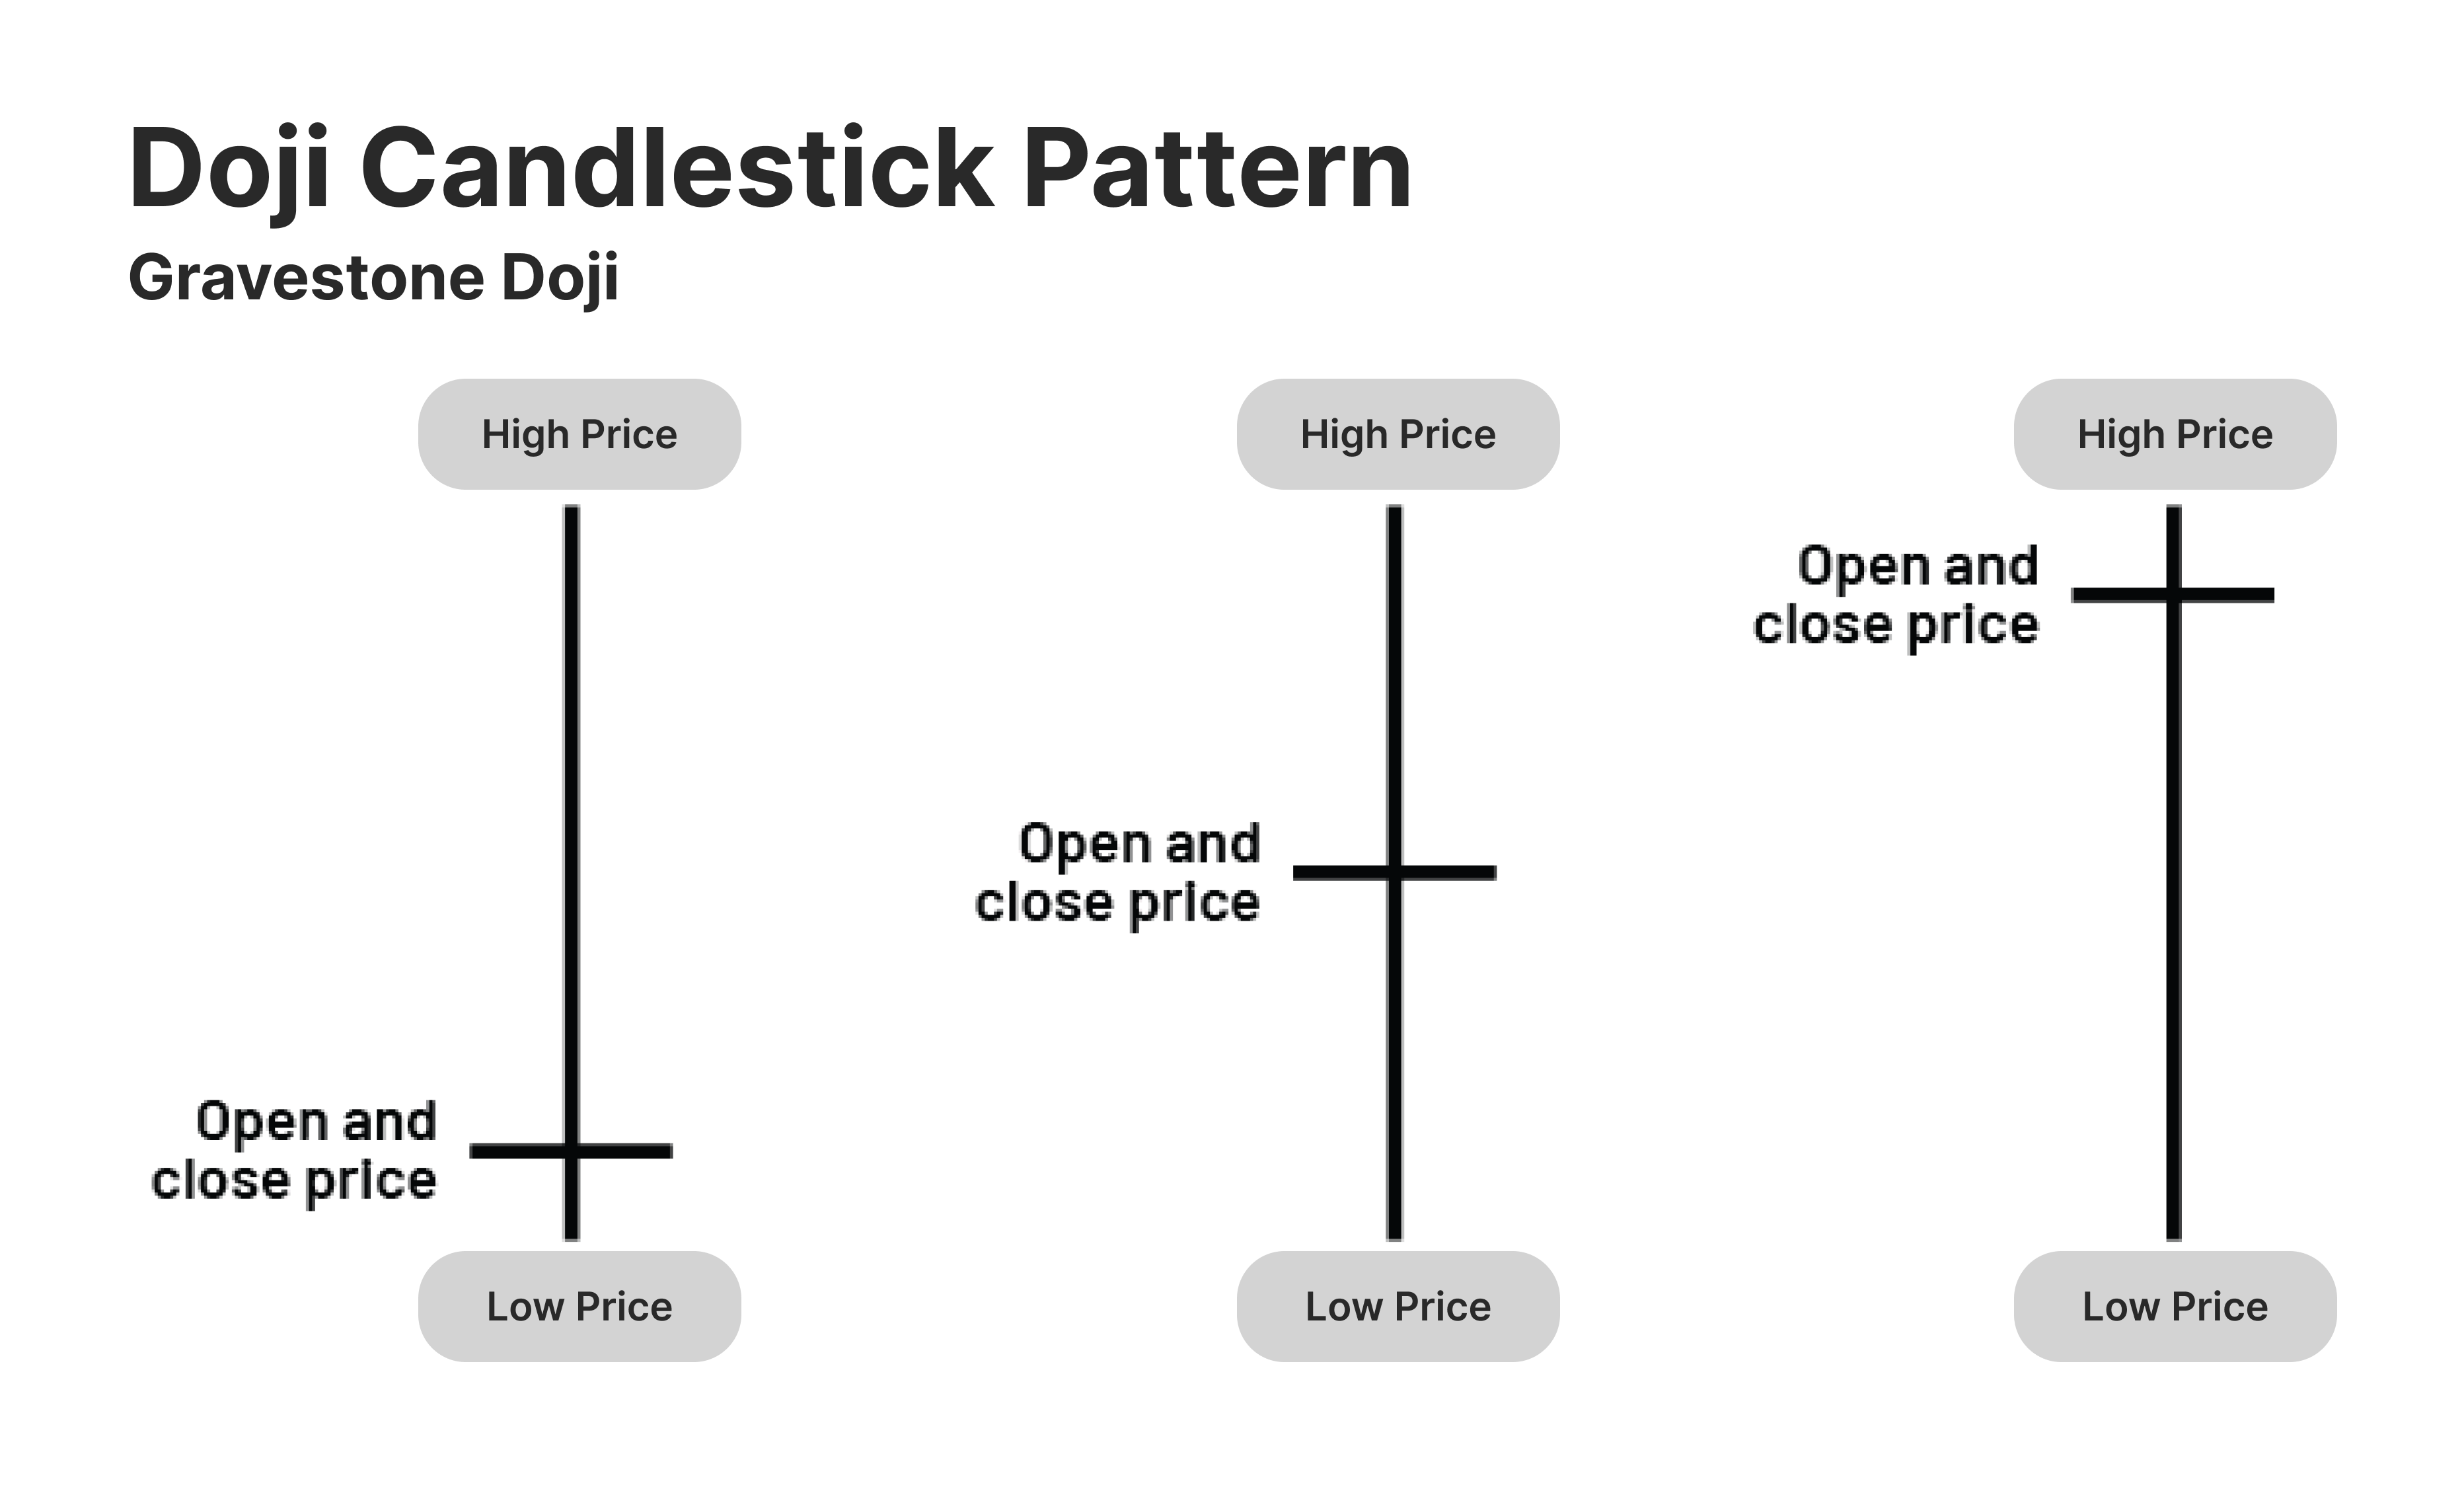
A doji candlestick is one of the most important candlestick patterns for traders because it highlights a moment of equilibrium between buyers and sellers. This pattern appears when the market opens, fluctuating significantly in both directions but closing near or at the same price it opened.
The formation of a doji candle indicates that neither the bulls nor the bears have gained complete control, leaving the market indecisive. As a result, traders often view this pattern as a potential precursor to a significant change in the market direction, especially when it appears after a sustained trend.
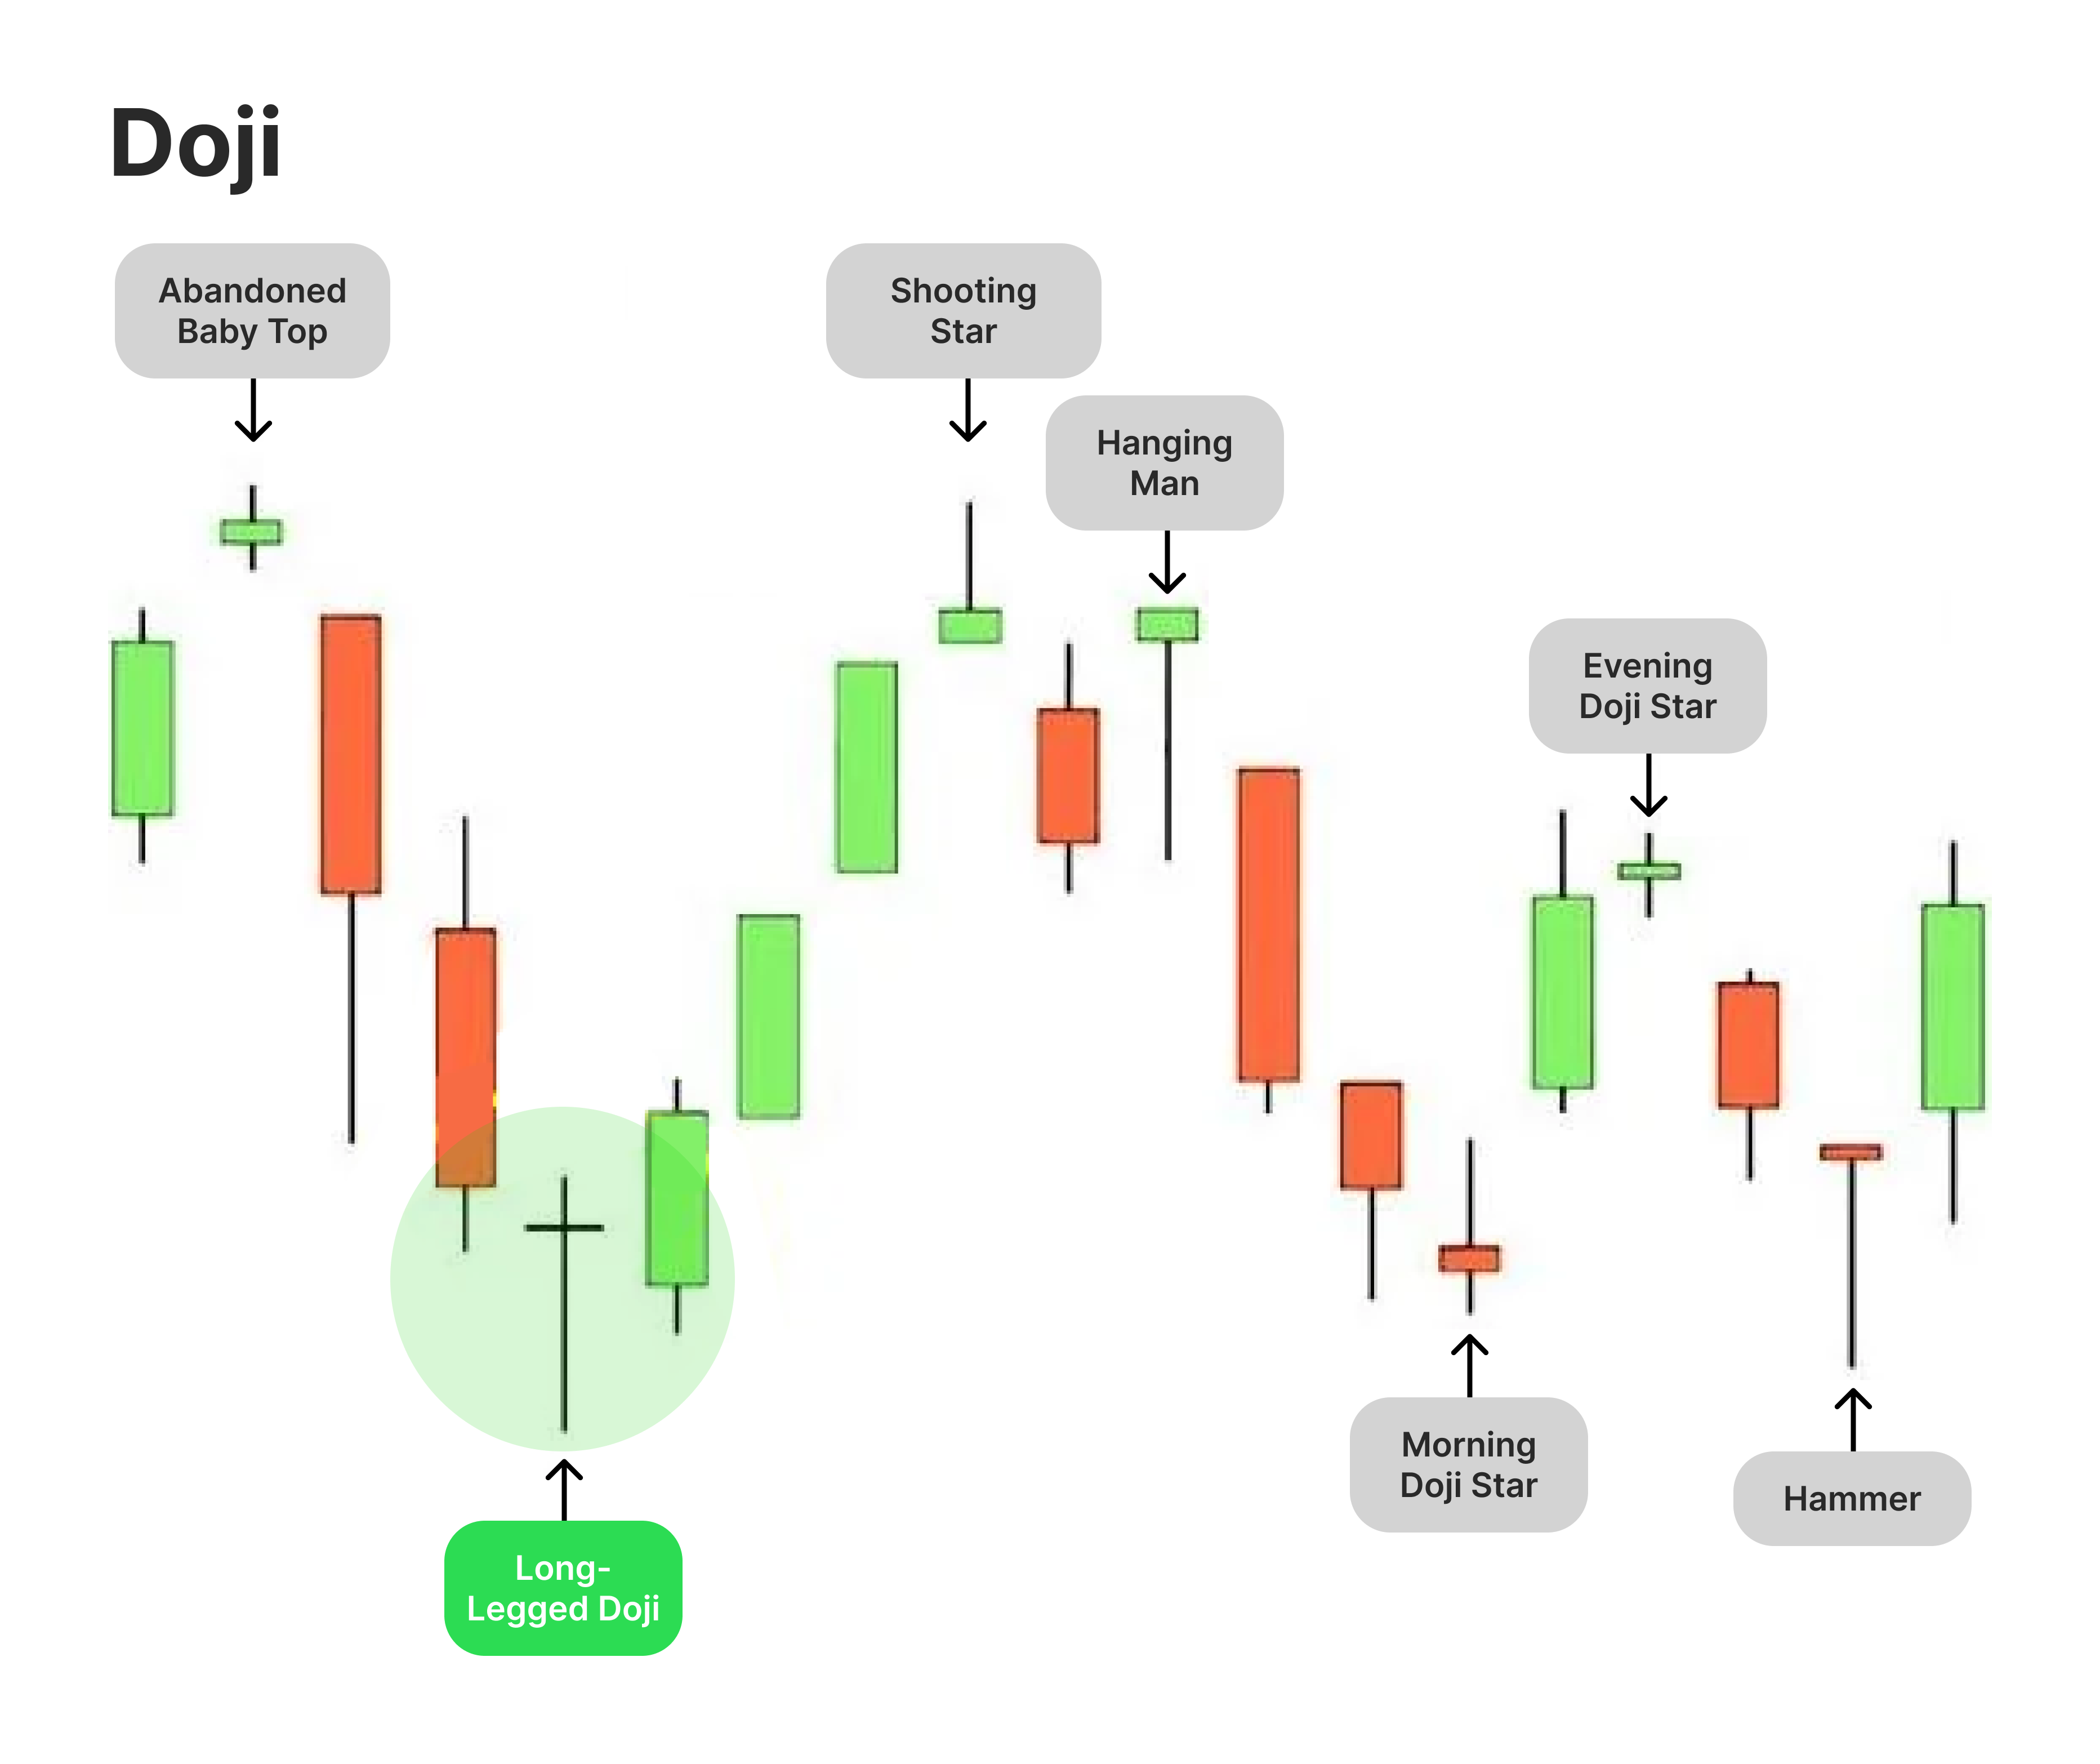
The doji candle is easy to recognise due to its minimal or non-existent body, distinguishing it from other candlestick patterns with a clear bullish or bearish sentiment.
The long shadows (wicks) extending above or below the body represent the highs and lows of the trading session, demonstrating how price volatility was present during the time period, but buyers and sellers were evenly matched by the end of it. This balancing act often hints at a possible reversal, mainly near key support or resistance levels.
However, a doji pattern should not be used to make trading decisions in isolation. Its real value comes from the context in which it appears. For example, if a doji occurs at the top of an uptrend, it may suggest that the buying momentum is weakening, signalling a potential bearish reversal.
Conversely, if it forms at the bottom of a downtrend, it could mean that selling pressure is dissipating, hinting at a bullish reversal. Traders often pair the doji with other technical metrics, such as moving averages or trend lines, to confirm whether a reversal or continuation of the trend is likely.
Fast Fact
Technical analysts often observe doji and spinning top candles within larger patterns, like star formations. Individually, both candles signal market indecision and neutrality in price movement.
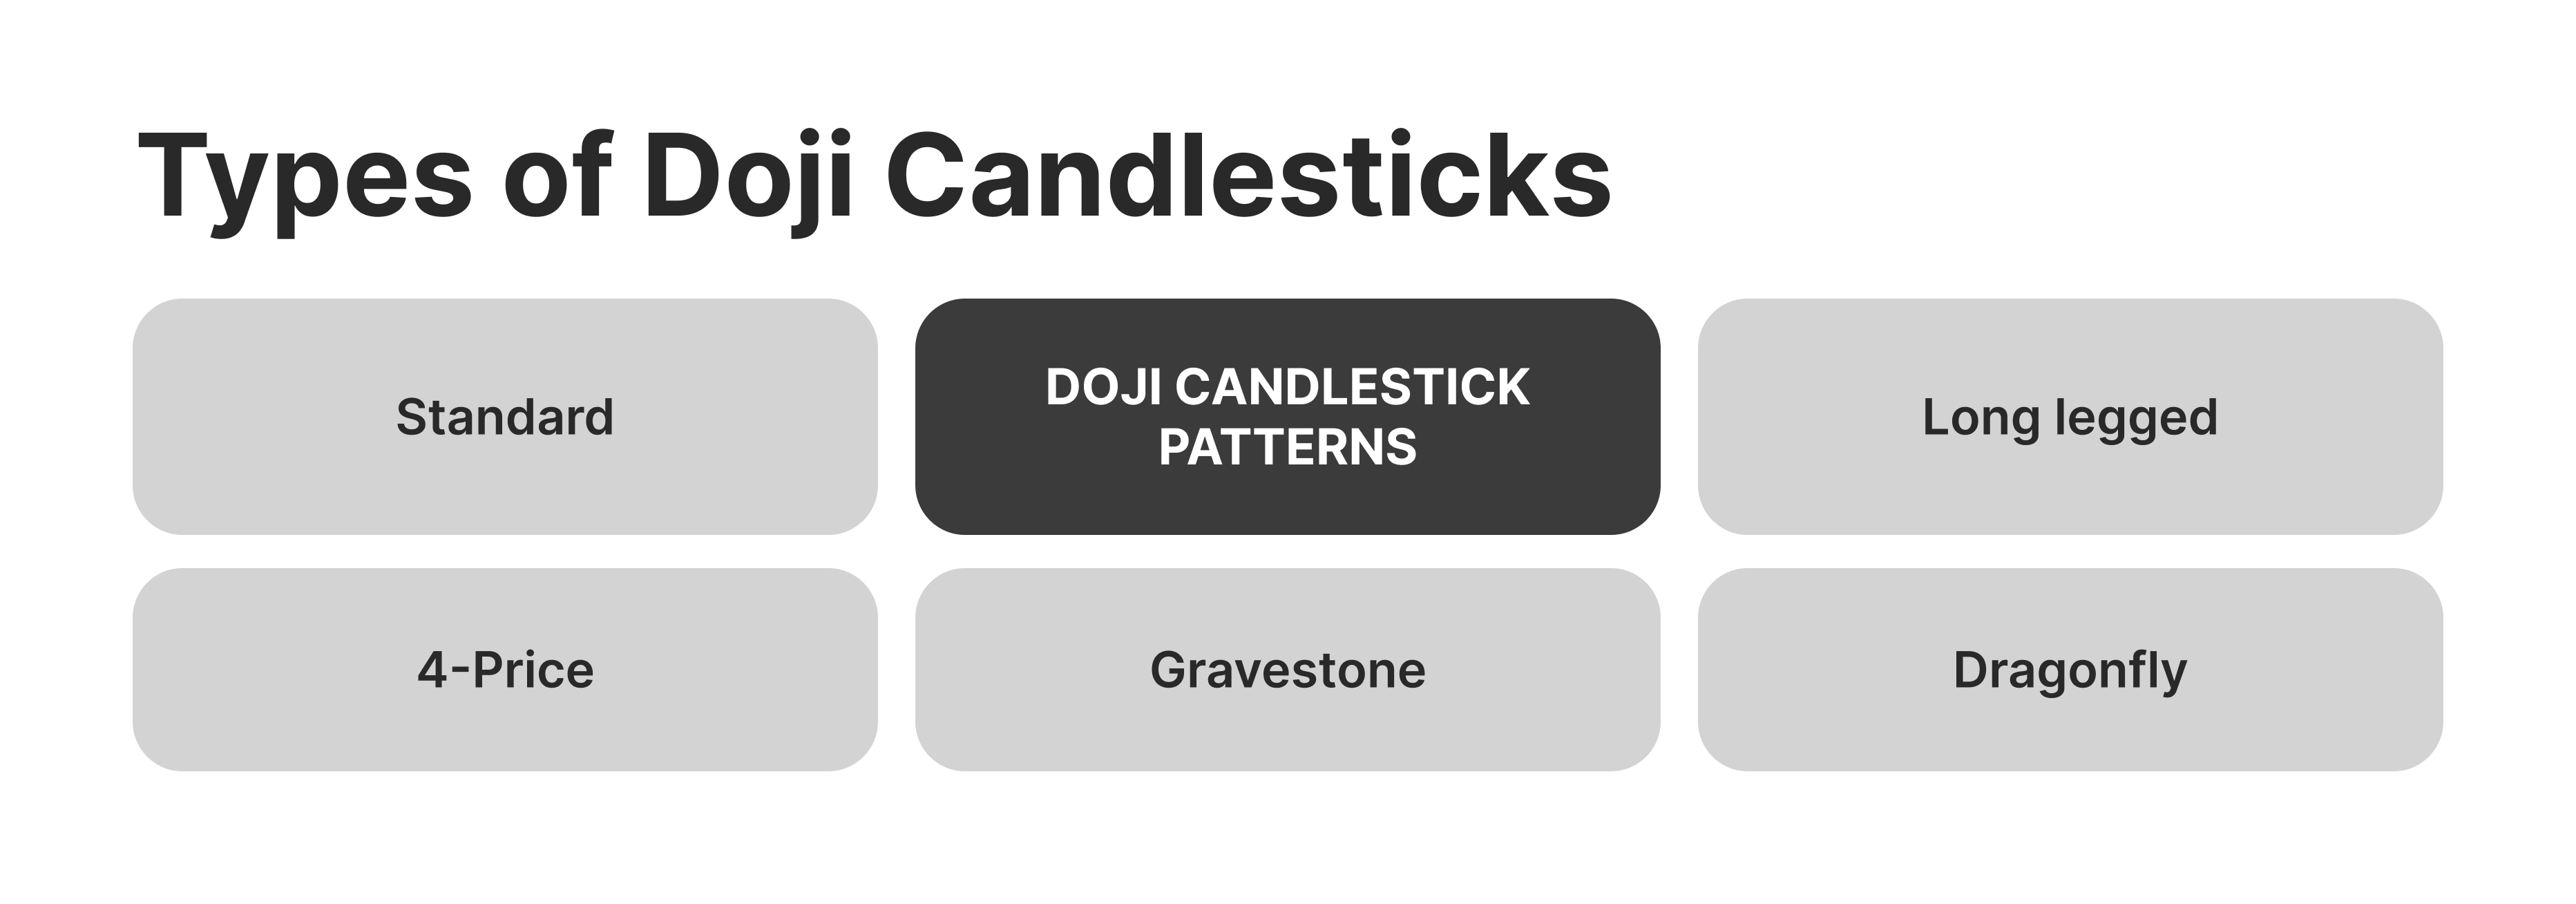
In trading practice, the doji pattern has become an essential element of technical analysis of market trends and patterns. At the same time, many doji candle types differ in characteristics and how to interpret the data obtained by tracking the data of opening and closing trading sessions. Here are the main types:
The standard doji indicates that neither buyers nor sellers could dominate the market during the session. The market opens, and the price fluctuates, but by the end of the session, the price returns near the open, showing indecision.
Appearing after a strong upward or downward trend signals that the current trend may be losing strength. However, it should not be taken as a reversal signal but rather as a potential turning point requiring further confirmation.
When spotted after a long trend (bullish or bearish), a standard doji can indicate a possible exhaustion of the prevailing trend. Traders seek confirmation from subsequent candlesticks to decide whether to enter a trade in the opposite direction.
A standard doji can also precede breakout movements in a consolidating market. Use the next candlestick’s direction to trade a breakout, placing stop-loss orders slightly below or above the doji’s range.
The long-legged doji suggests significant uncertainty and volatility in the market. The extended shadows indicate strong buying and selling pressure during the session, but neither side prevailed. This creates high volatility but no clear trend.
While it can signal reversals, assessing the context in which it appears — whether after a sharp rise or fall, is essential. Such cases show that traders hesitate to continue with the prevailing trend.
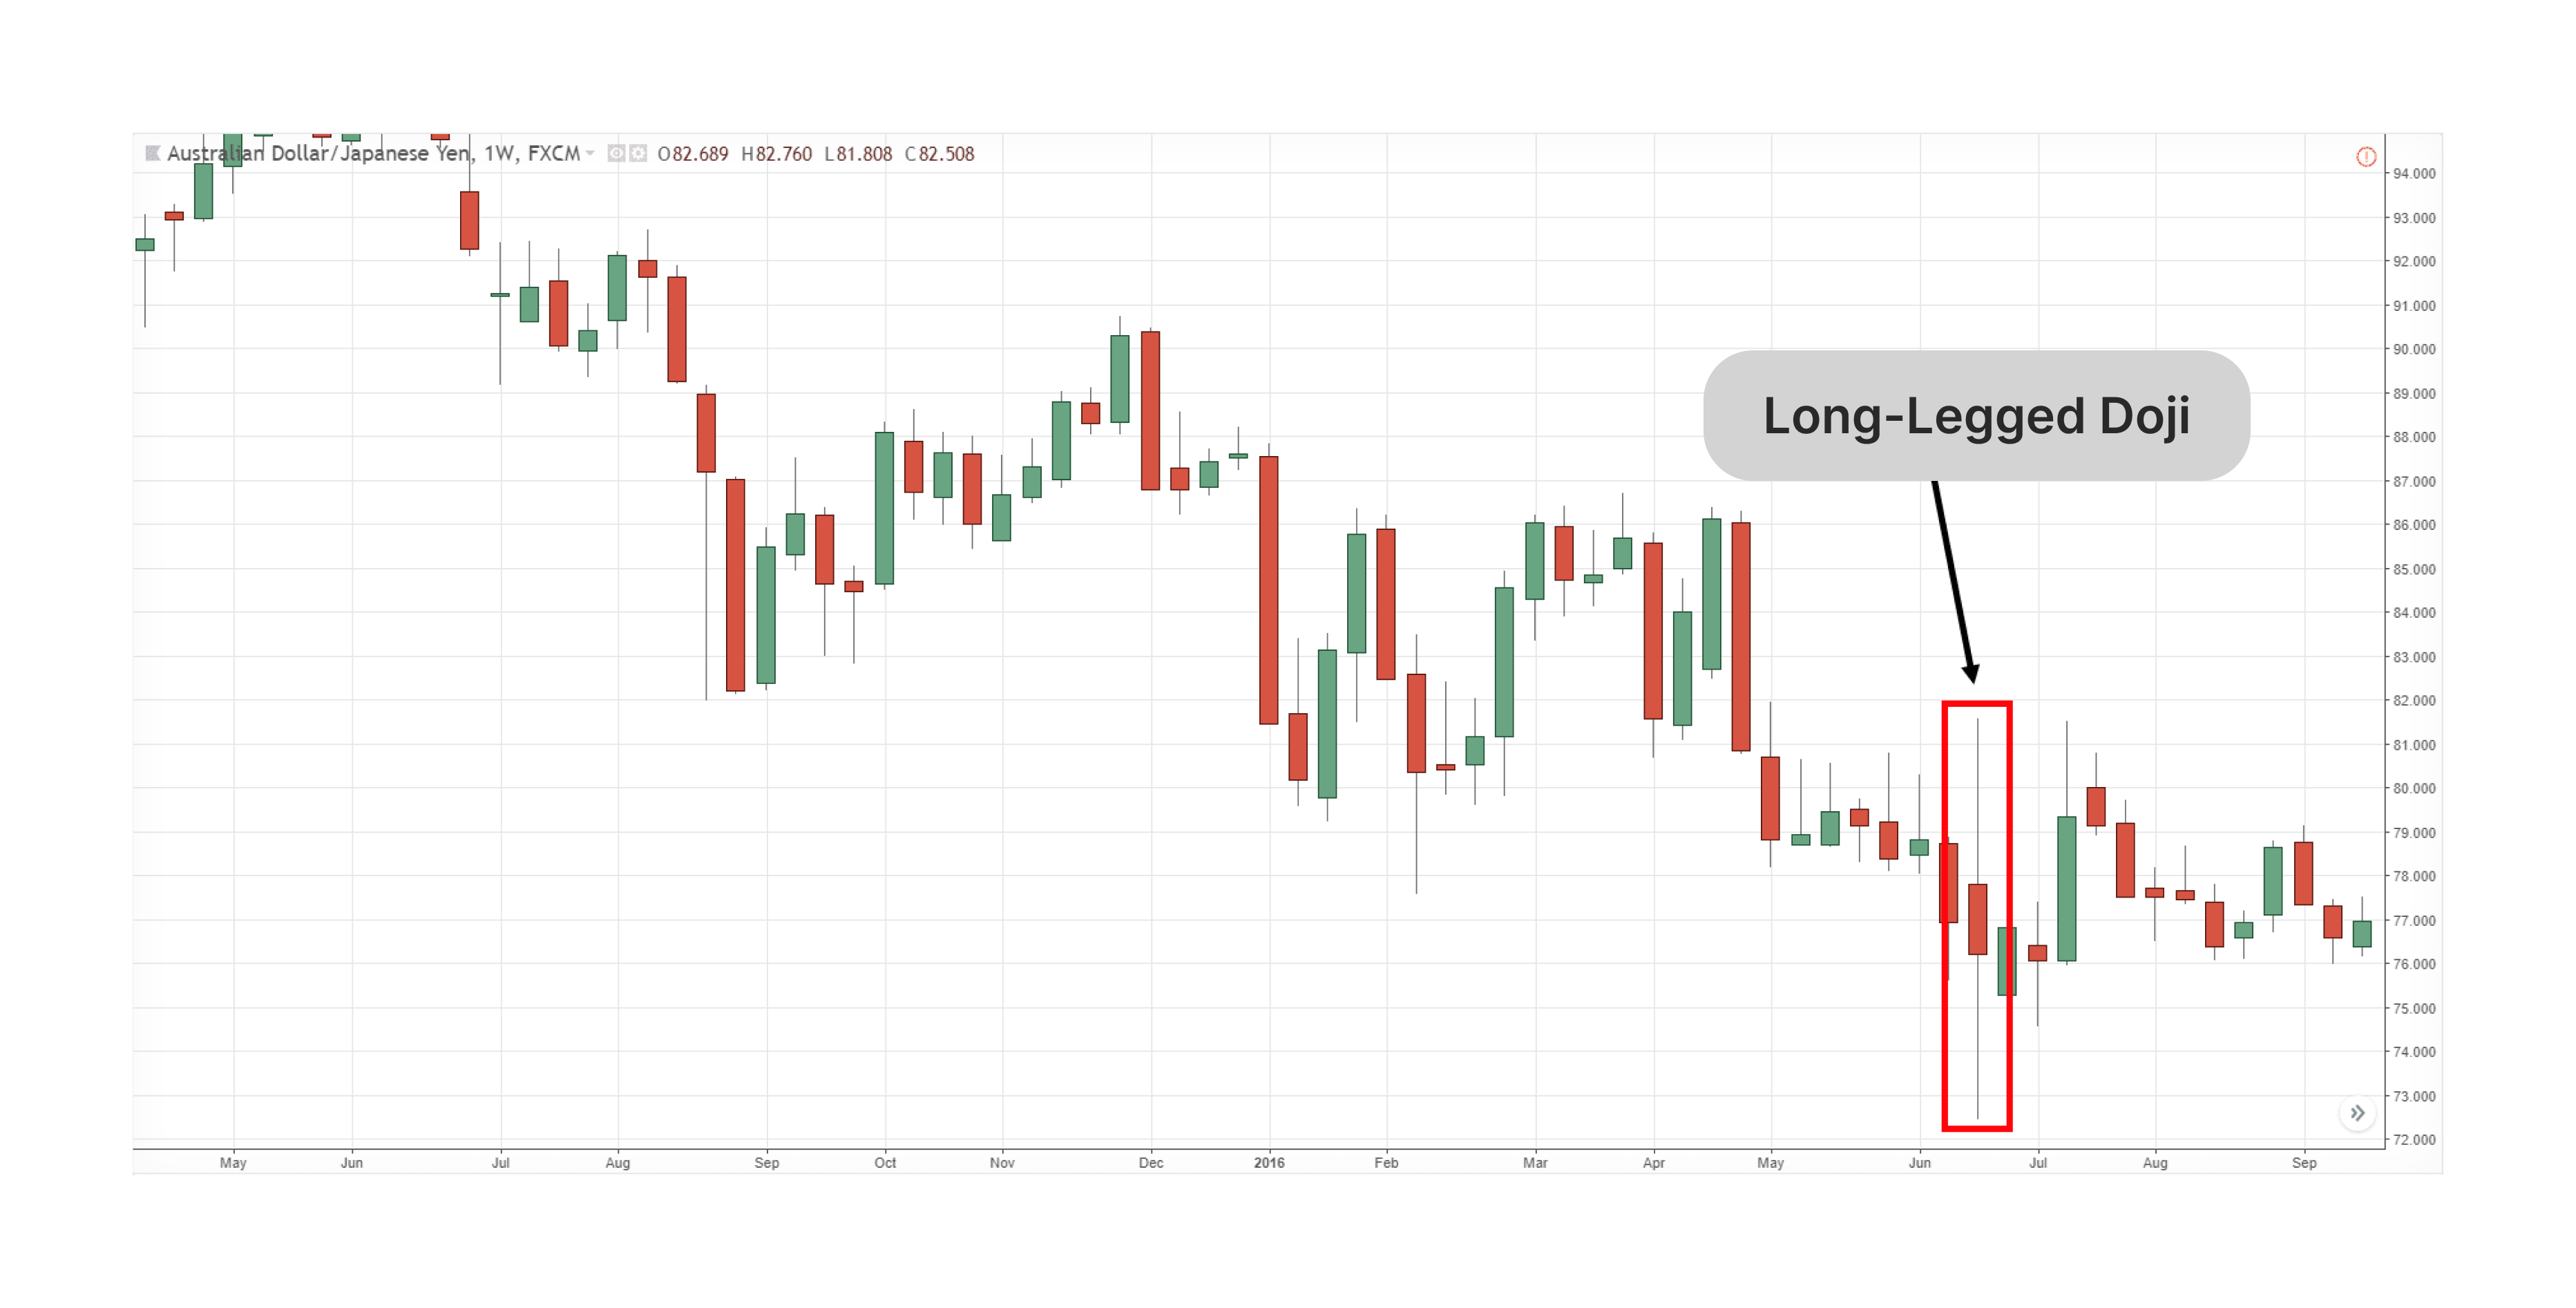
If this doji forms a strong trend, wait for a significant follow-up candle that confirms direction before taking a position. Due to the volatility, placing stop-losses further away from the doji’s high or low can help manage risk.
This doji works well when combined with bollinger bands. If the Long-legged doji forms near the upper or lower bands, it can signal that price action is reaching an extreme, leading to a possible reversal.
The gravestone doji occurs when buyers initially push prices up during the session, but sellers gain control and drag the price back down to the opening level. This often results in a bearish signal, suggesting buyers have lost momentum.
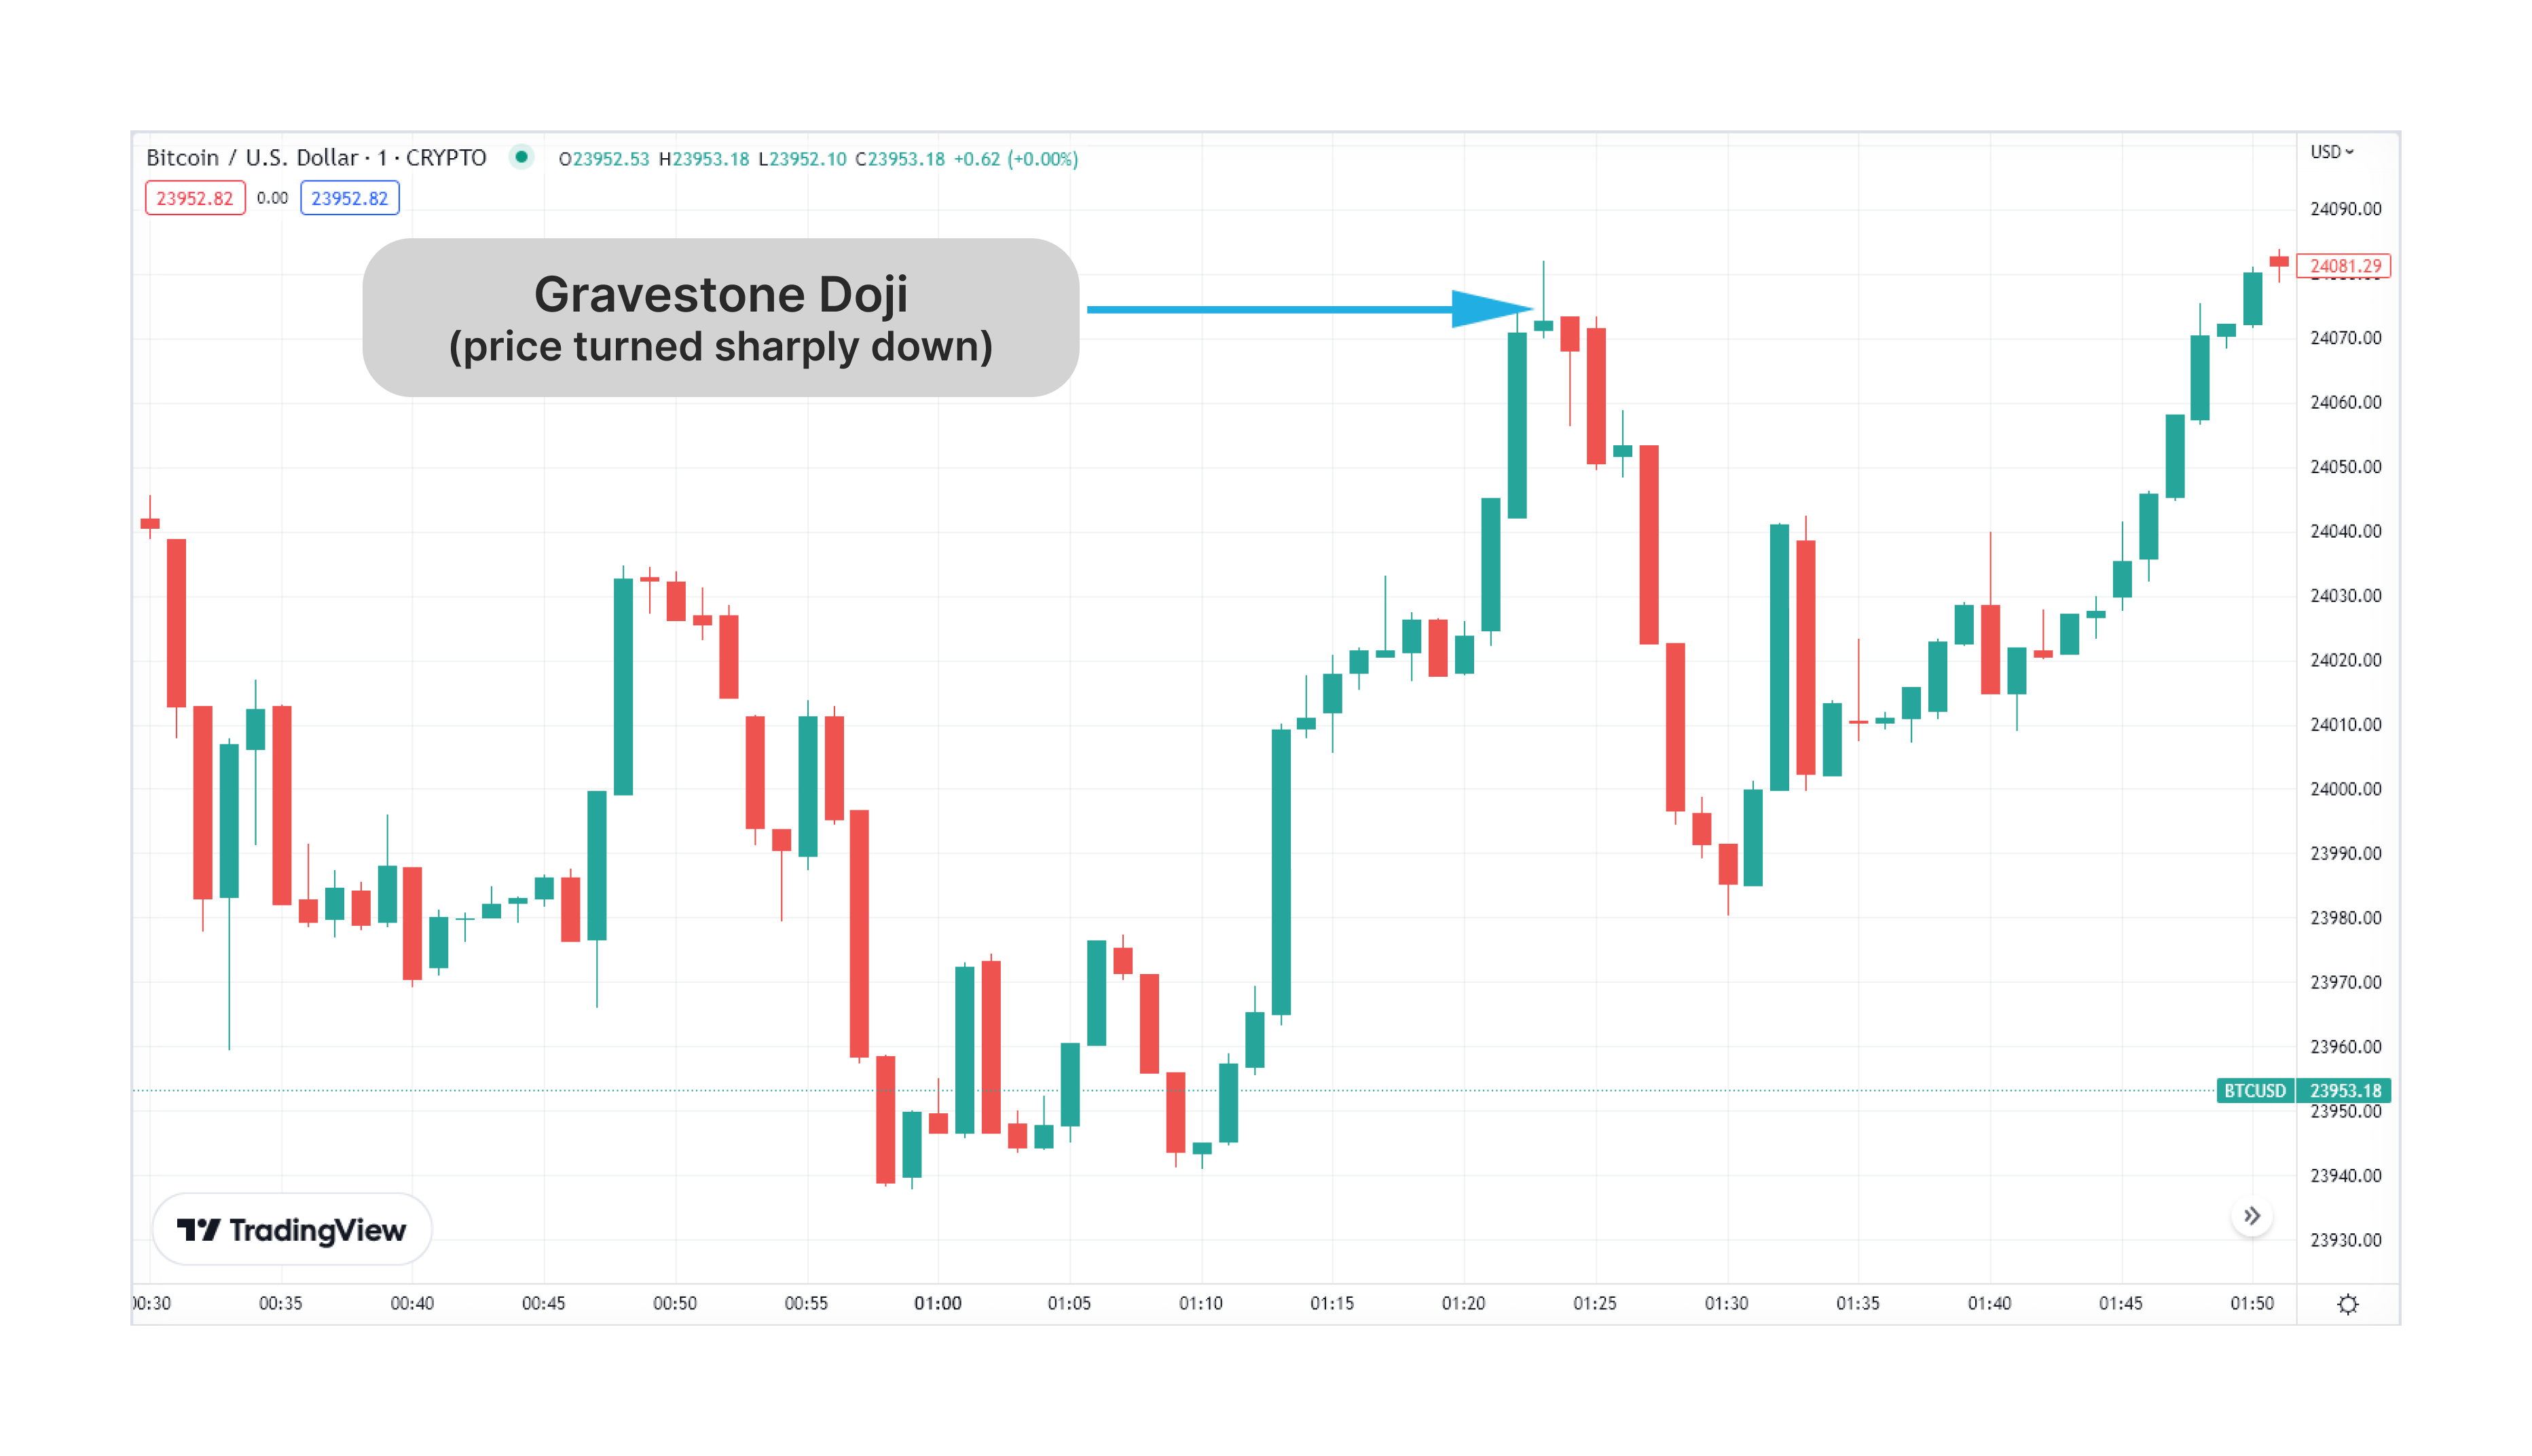
Appearing at the top of an uptrend, it’s often viewed as a bearish reversal signal. It indicates that the bulls have pushed the price as far as they can, but sellers have stepped in, showing that the uptrend may be over.
The gravestone doji is a powerful signal when it forms at the top of an uptrend. Traders wait for confirmation with a bearish candle after the doji enters a short position. Place stop-losses above the doji’s high to limit risk.
The Gravestone doji works well near intense resistance levels. If it forms near a known resistance level, it’s a sign that the price may not break through, providing an opportunity to enter a short position.
The dragonfly doji forms when sellers dominate early in the session, pushing prices lower, but buyers regain control by the end of the session and push the price back near the opening level. This shows strong buying pressure, suggesting a potential bullish reversal.
Appearing after a downtrend, the dragonfly doji is often seen as a bullish reversal signal, as it reflects that sellers have lost control and buyers are gaining strength.
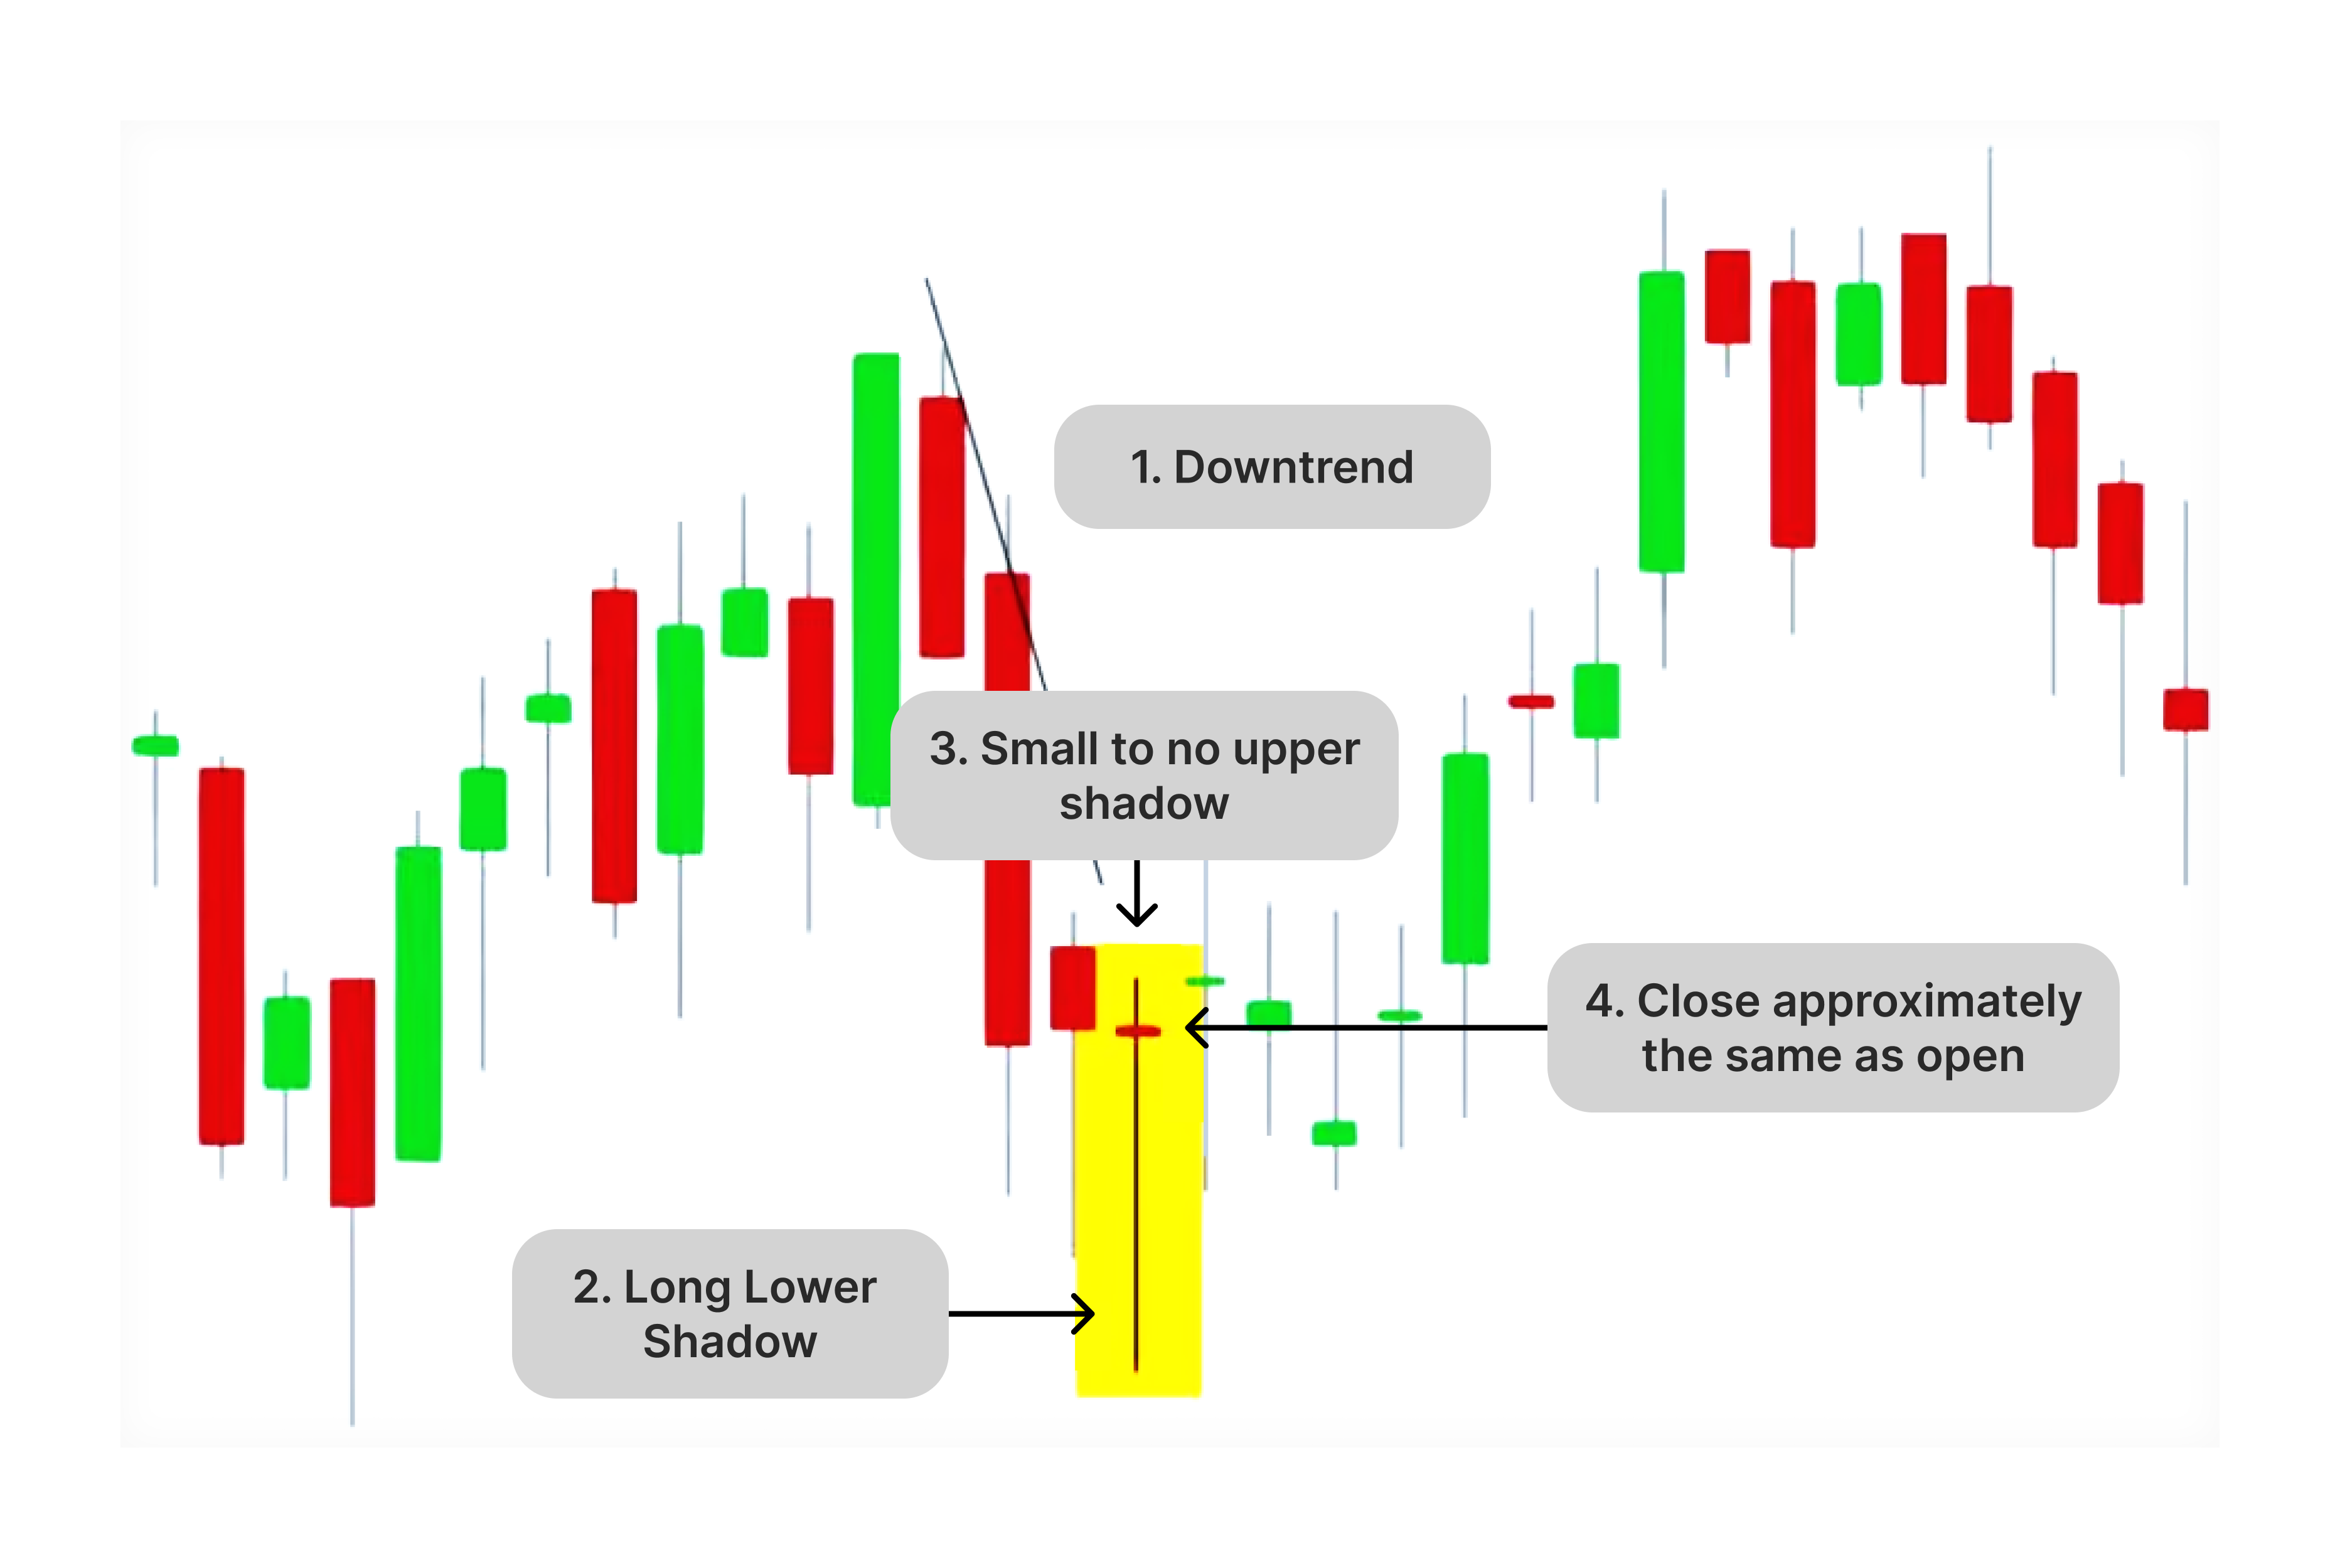
When this doji forms at the bottom of a downtrend, traders look for a follow-up bullish candle to confirm the reversal. Entering a long position with a stop-loss below the doji’s low is a common strategy.
Combine the dragonfly doji with Fibonacci retracement levels. If it forms near a critical Fibonacci support level, it increases the likelihood of a bullish reversal, providing a high-confidence trade setup.
The four-price doji is very rare and indicates that the market was completely flat, with no discernible movement in any direction. This occurs when the open, close, high, and low prices are the same, suggesting a total absence of volatility.
This pattern shows extreme market indecision, where neither buyers nor sellers take the initiative. It’s more common in very illiquid markets or during very low trading activity periods.
Traders generally avoid taking action when this pattern appears. Since it reflects market stagnation, waiting for more volatility or decisive price movement before trading is better.
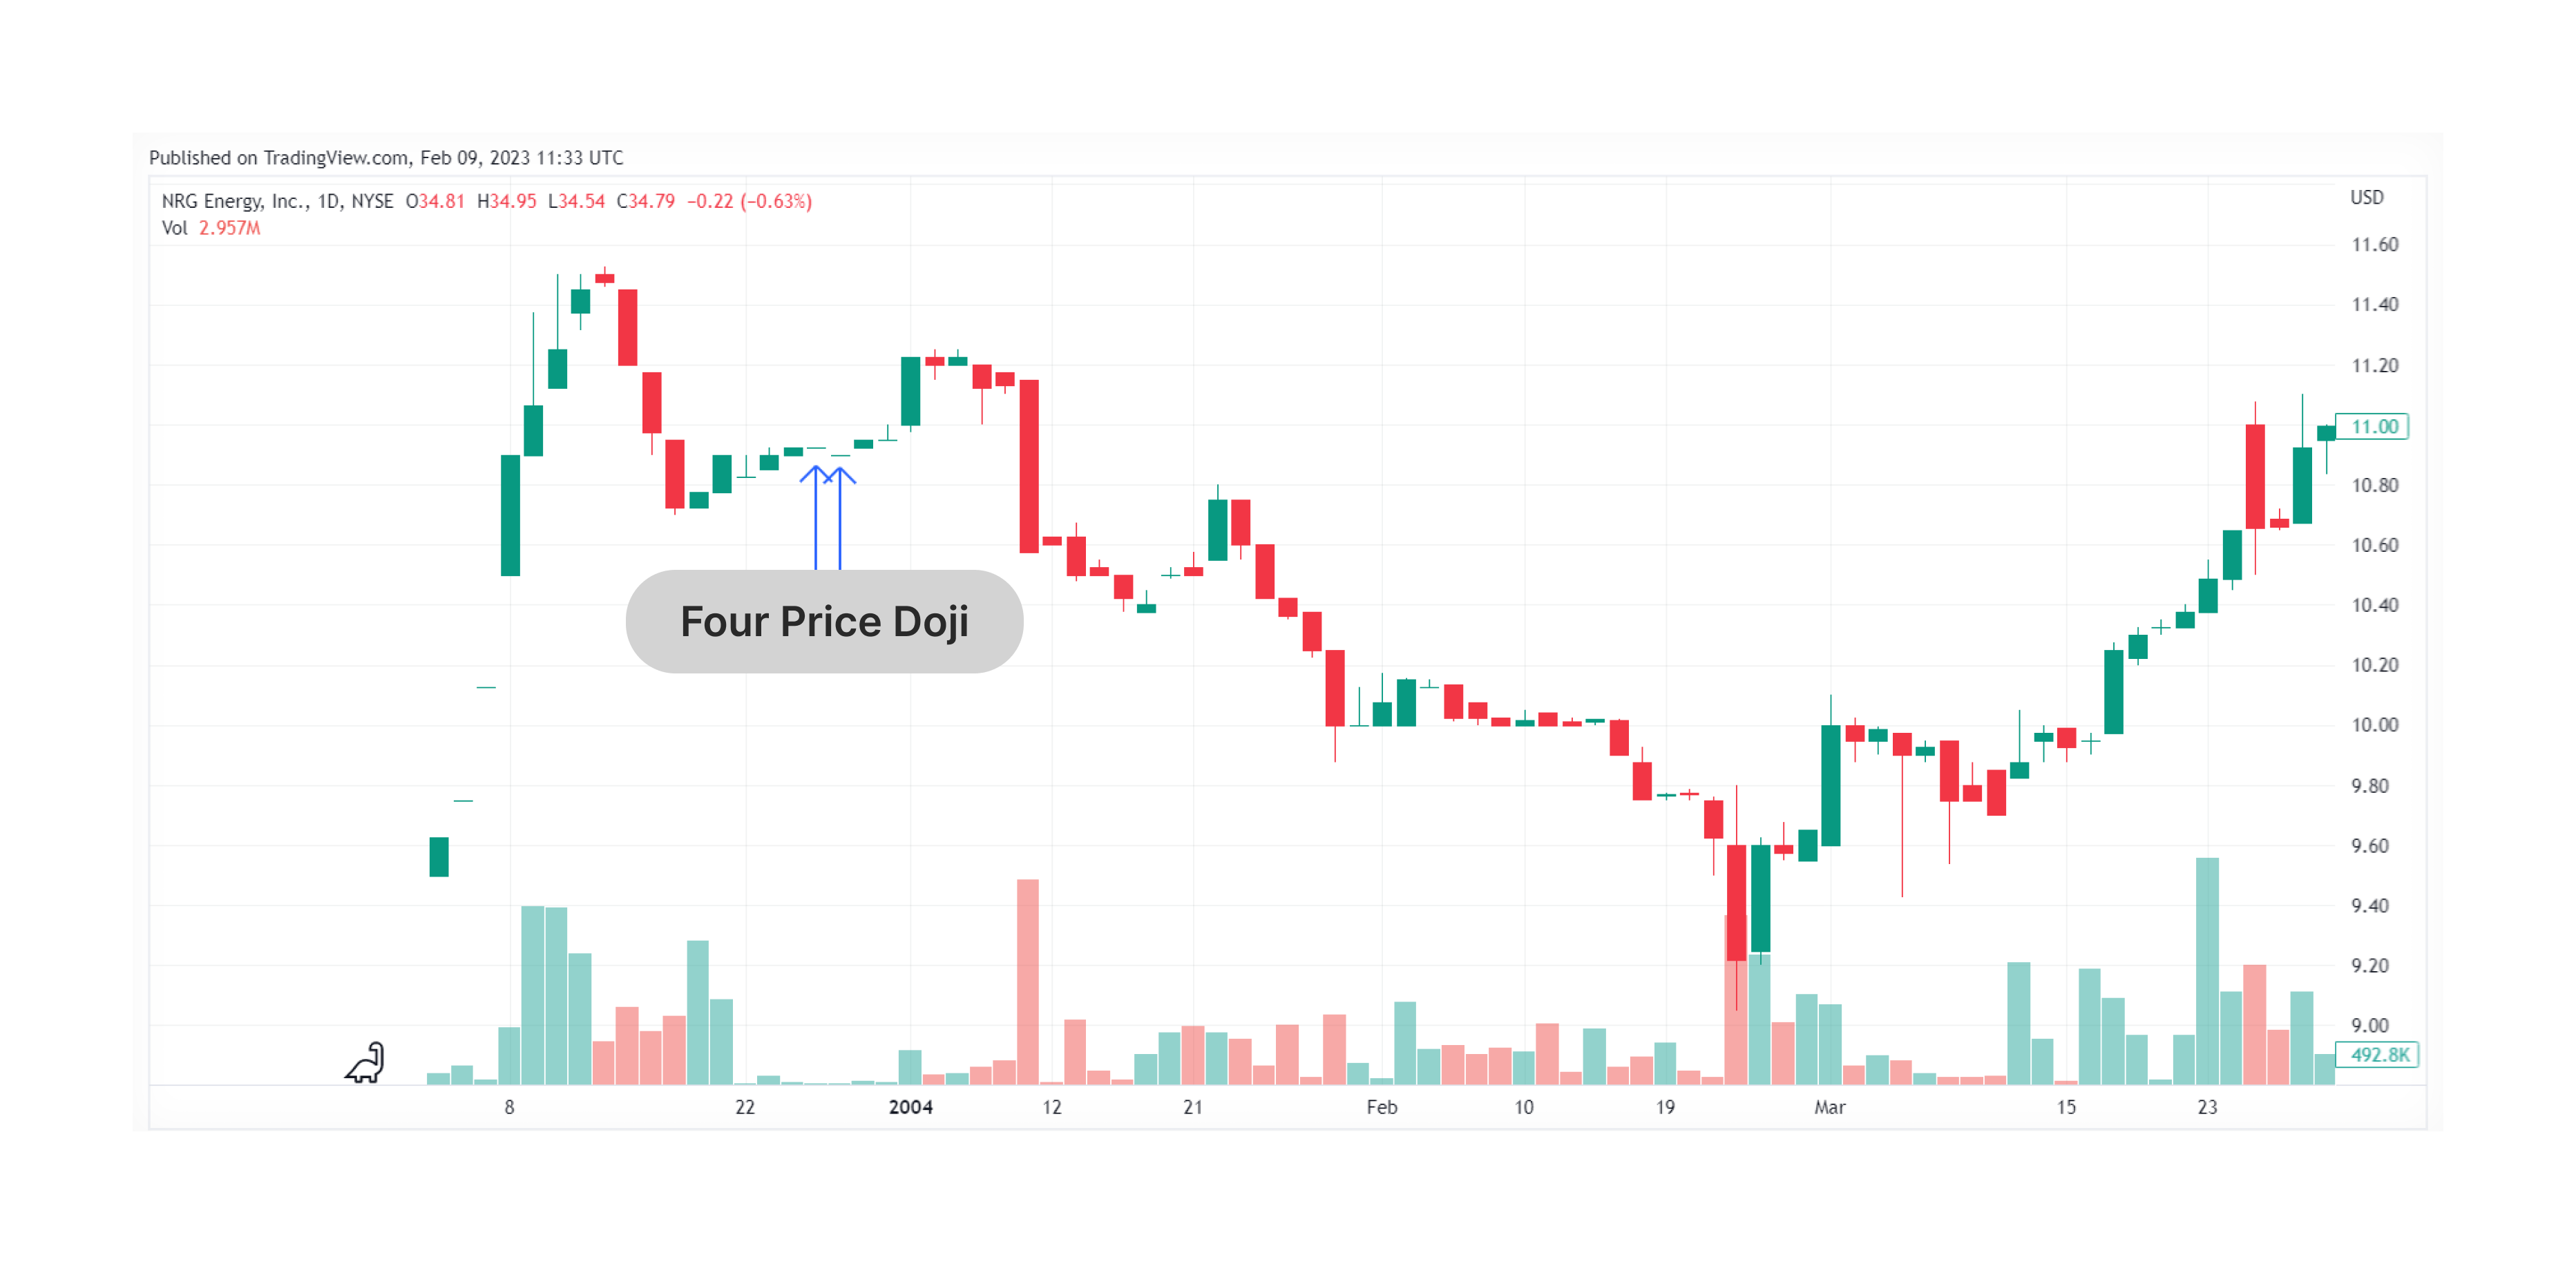
If the four-price doji appears within a consolidating market, it may precede a breakout. Look for a strong candlestick in either direction after the doji to signal entry points.
A doji candle represents a unique market condition that embodies indecision and hesitation among market participants. Its appearance carries important implications about the balance of buying and selling pressure and can signal potential shifts in market dynamics. Below is an expanded explanation of what a doji candle represents in the market:
The doji’s lack of a real body illustrates the equality between buyers and sellers. This tug-of-war results in neither side gaining significant ground, making the market undecided about its next move.
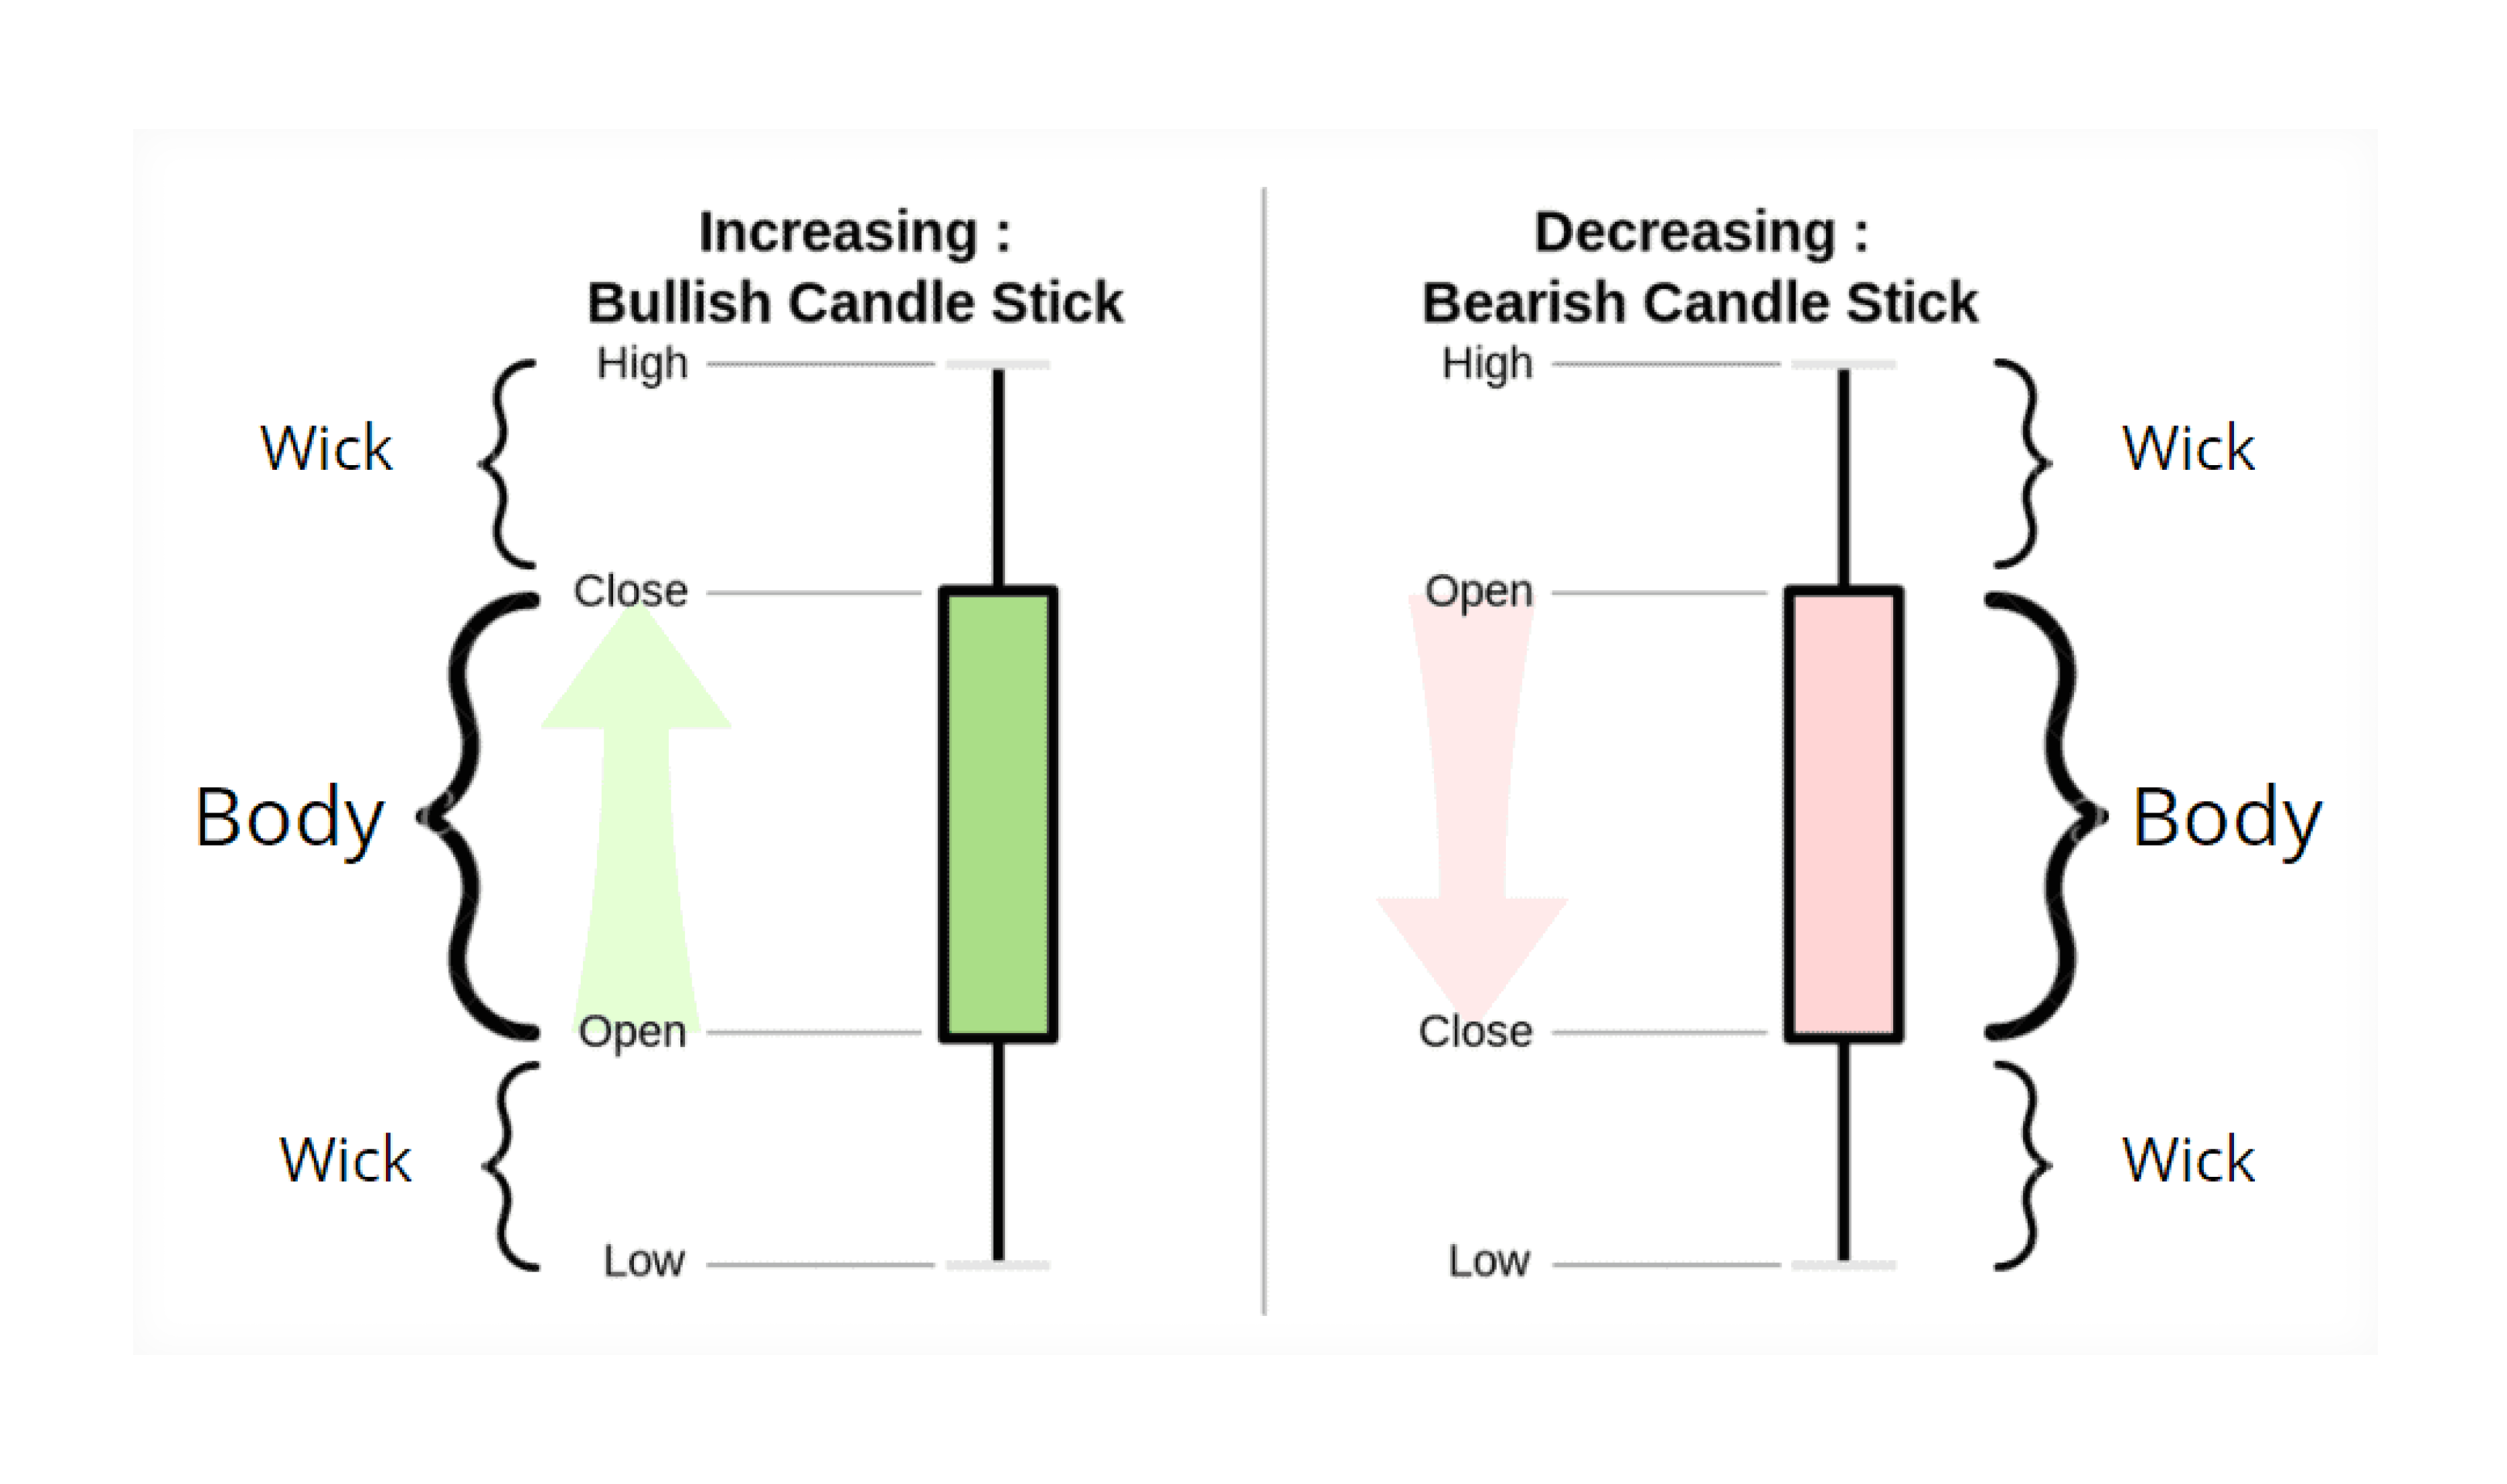
The doji represents a temporary state of equilibrium where the price action fluctuates between highs and lows during the trading session but closes at or near the same level as the opening price. The lack of a clear winner indicates that traders are hesitant, possibly waiting for new information or clearer signals before committing to a direction.
This type of candle suggests the market may need a catalyst (e.g., economic data release, earnings report) to break the deadlock between buyers and sellers. Until then, the price may continue to consolidate.
A doji can signal the slowing of momentum, especially when it appears after a prolonged trend. The market participants are reevaluating the direction of the trend, possibly because they believe the price has reached an overbought or oversold condition.
In a strong uptrend, the appearance of a doji may hint at buyer exhaustion. The market may not have enough bullish sentiment to increase the price, leading to a potential reversal or consolidation. A doji may signal that the selling pressure is losing steam in a downtrend. Buyers may begin to step in, preparing for a possible reversal to the upside.
Despite its potential as a reversal indicator, the doji should not be used in isolation. Confirmation from the next candlestick (e.g., a bullish engulfing pattern after a doji in a downtrend) is critical for validating the signal. Without confirmation, the trend may simply resume.
A doji appearing during a market consolidation phase often reflects uncertainty about the next move. In this scenario, traders hesitate to push the price in either direction, waiting for clearer signals or external market developments.
Consolidation periods are often marked by a series of doji candles, where the market is "range-bound" and lacks a decisive trend. Traders can take advantage of these situations by trading within the range until a breakout occurs.
A doji in consolidation signals that a breakout is likely on the horizon. Once the market resolves its indecision, the price could break sharply in either direction, making this a valuable opportunity for traders looking for volatility.
Doji candles convey that market sentiment is neutral — there’s no clear buying or selling pressure. This can happen when traders are uncertain about upcoming events, such as earnings reports, interest rate decisions, or geopolitical developments. The doji reflects the market's "wait-and-see" approach in these cases.
A doji during such a time frequently indicates that traders are unwilling to make aggressive bets without confirming the market’s next direction. This caution is typically reflected in lower trading volumes, as participants hold off on taking large positions until they see clearer trends.
With its extended wicks, the long-legged doji signals heightened volatility during the session. The long upper and lower shadows represent attempts by both bulls and bears to control the market, but ultimately, the session closes near the opening price.
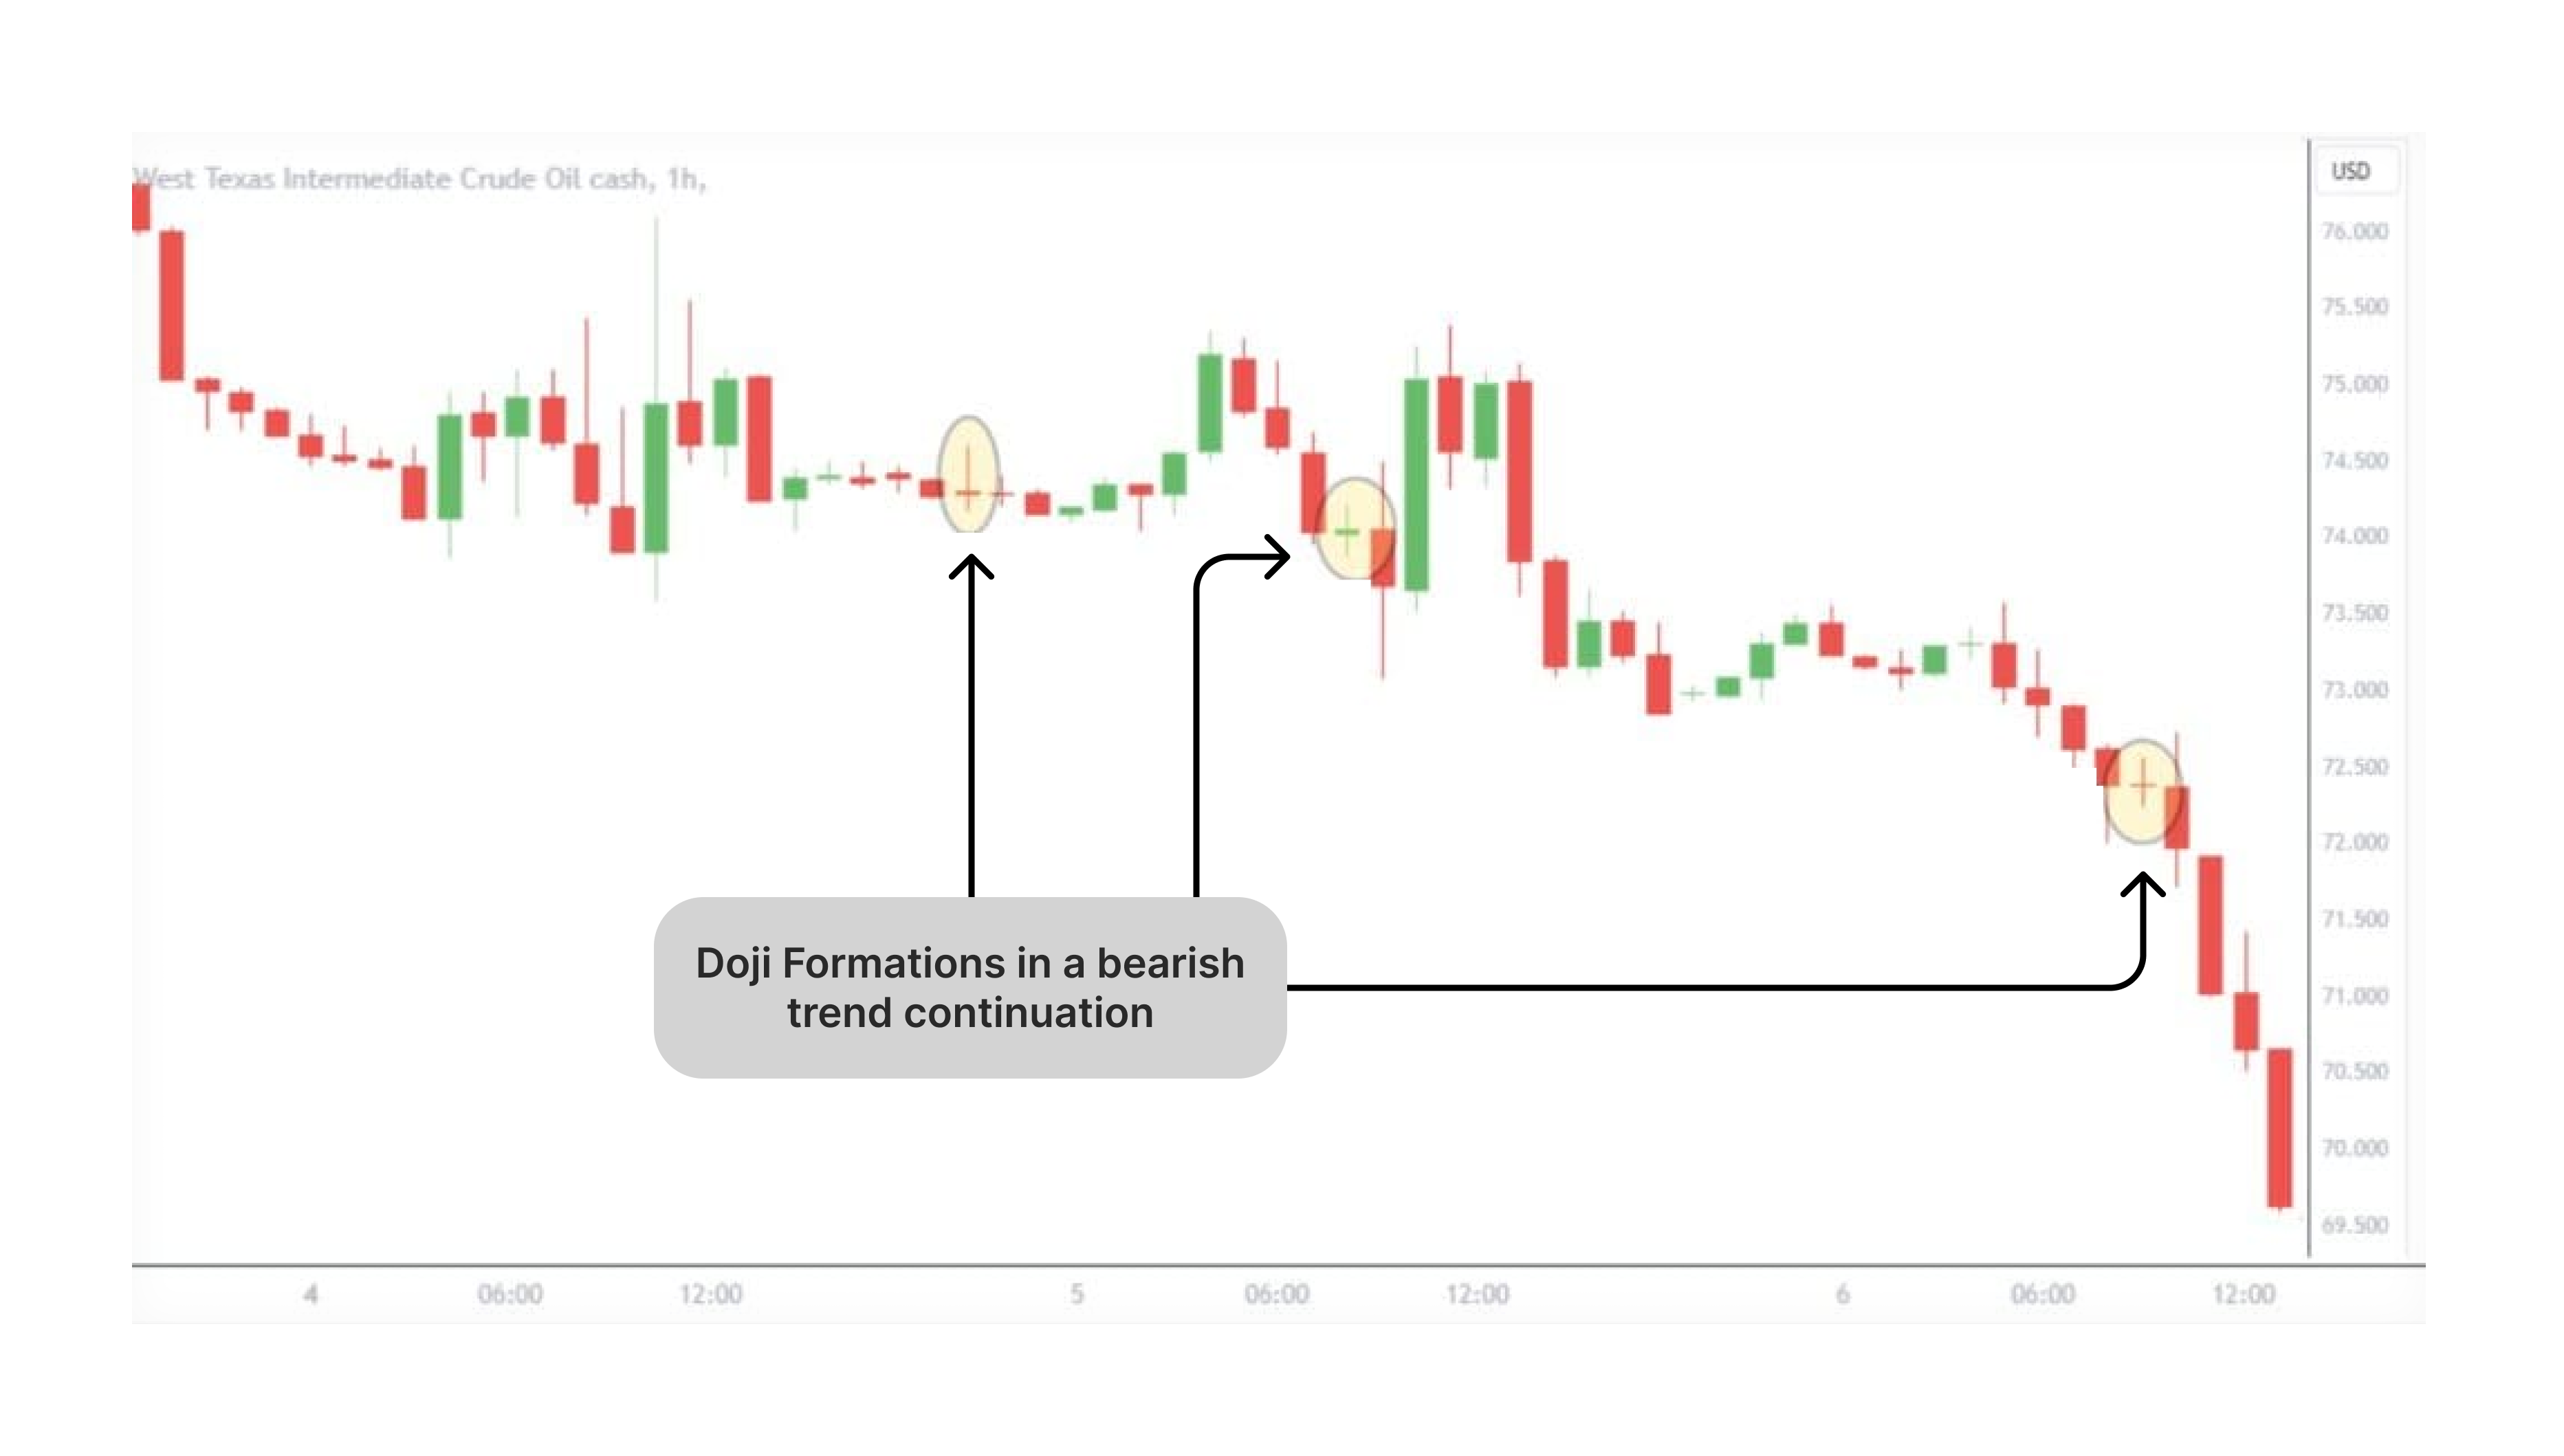
This form of doji is handy for identifying price tension, where large moves in both directions occur within a single session but without a decisive winner. Long wicks show significant interest on both sides of the market, which could lead to a major move once the balance tips.
The long-legged doji can be a prelude to a strong price movement in either direction, making it a valuable pattern for breakout traders who are looking to capitalise on market volatility.
A doji alone does not give a strong buy or sell signal. Traders must wait for confirmation from the next candlestick. For example, a bullish confirmation could come in the form of a bullish engulfing pattern or a strong upward move in the next session. A bearish confirmation could appear as a bearish engulfing pattern or a downward price action following the doji.
Volume is a critical factor when analysing a doji. A low-volume doji indicates a lack of participation, making it less reliable. However, if the doji forms in high volume, a drastic reversal in market behaviour may occur, and traders should pay close attention to the next candle.
Since doji signals indecision, traders must use tight stop-loss orders when entering a position based on this pattern. This helps protect against sudden and unpredictable market moves.
A doji in a strong uptrend may signify buyer exhaustion. However, the trend could still continue if the next candle confirms the uptrend. Traders often combine the doji with other indicators, such as the relative strength index (RSI) or moving averages, to decide whether to expect a reversal or continuation.
A doji after a sharp downtrend could signal that the sellers are losing momentum. If the next candle is bullish, it may indicate the start of a reversal. Conversely, if the next candle is bearish, it confirms the continuation of the downtrend.
During low volatility or consolidation phases, a doji can act as a precursor to a breakout. Traders typically use tools like bollinger bands or support/resistance levels to predict the likely breakout direction.
The doji reflects a psychological stand-off in the market. Bulls and bears both try to assert dominance, but the end result is that neither side gains control. This emotional struggle can result in large price moves once the deadlock is broken.
The uncertainty a doji represents often leads to cautious trading. Traders may wait for confirmation or use tighter stops to manage risk. Experienced traders understand that a doji signals the market is at a decision point, but without confirmation, it could lead to false signals.
The doji candle pattern is a powerful tool in technical analysis, offering valuable perspectives into market behaviour, potential reversals, and continuation of trends. Its ability to signify indecision between buyers and sellers makes it a crucial indicator of turning points in the market.
However, it is essential to remember that doji candles should not be used in isolation. For optimal results, traders must combine them with other technical metrics, such as volume analysis, moving averages, or support and resistance levels, to confirm the market's next direction.
A doji candle pattern is a type of candlestick formation in technical analysis where an asset's opening and closing prices are nearly identical.
Depending on the type, a doji candle appears as a cross, a plus sign, or a "T" shape on the chart.
A doji candle indicates indecision or a balance between buyers and sellers in the market.
Yes, a doji can indicate that the market pauses temporarily before continuing in the same direction. This usually happens in a strong trend, where the doji represents a momentary consolidation or indecision.