All About Moving Average (MA): A Key Technical Indicator for Traders

 By Nato Maisuradze
With a Bachelor's Degree in International Journalism, my career has taken me through diverse industries. I began in the banking sector, gaining valuable insights into finance over five years. This foundation led me to fintech, where I began to merge my financial understanding with my passion for writing. As a copywriter, I use my diverse experience to create content that's easy to understand and engaging, helping readers feel confident and informed about financial matters.
 By Tamta Suladze
Tamta is a content writer based in Georgia with five years of experience covering global financial and crypto markets for news outlets, blockchain companies, and crypto businesses. With a background in higher education and a personal interest in crypto investing, she specializes in breaking down complex concepts into easy-to-understand information for new crypto investors. Tamta's writing is both professional and relatable, ensuring her readers gain valuable insight and knowledge.

When we talk about doing business or efficiently performing any task, before proceeding to action, we start looking for the necessary tools or various opportunities to complete the assigned task perfectly and with quality. The financial field is very developed in this regard and is full of different tried and tested mathematical formulas that have adapted over time and become the standard.
Traders and investors are no exception, and they need dependable tools to spot price trends and make profitable decisions. One such tool is the moving average. Moving averages provide a clearer picture of underlying trends by smoothing out price fluctuations over a chosen timeframe, helping investors identify potential buying or selling opportunities.
This comprehensive guide unpacks everything you need to know about moving averages, from their basic formula to advanced trading strategies.
Moving averages smooth out price data, helping traders identify underlying trends and potential reversals.
There are two main types of moving averages: simple moving averages (SMAs) and exponential moving averages (EMAs). Each offers unique advantages and disadvantages.
Moving averages can be used to generate trading signals, such as buy and sell opportunities, by analysing their interaction with price movements and support/resistance levels.
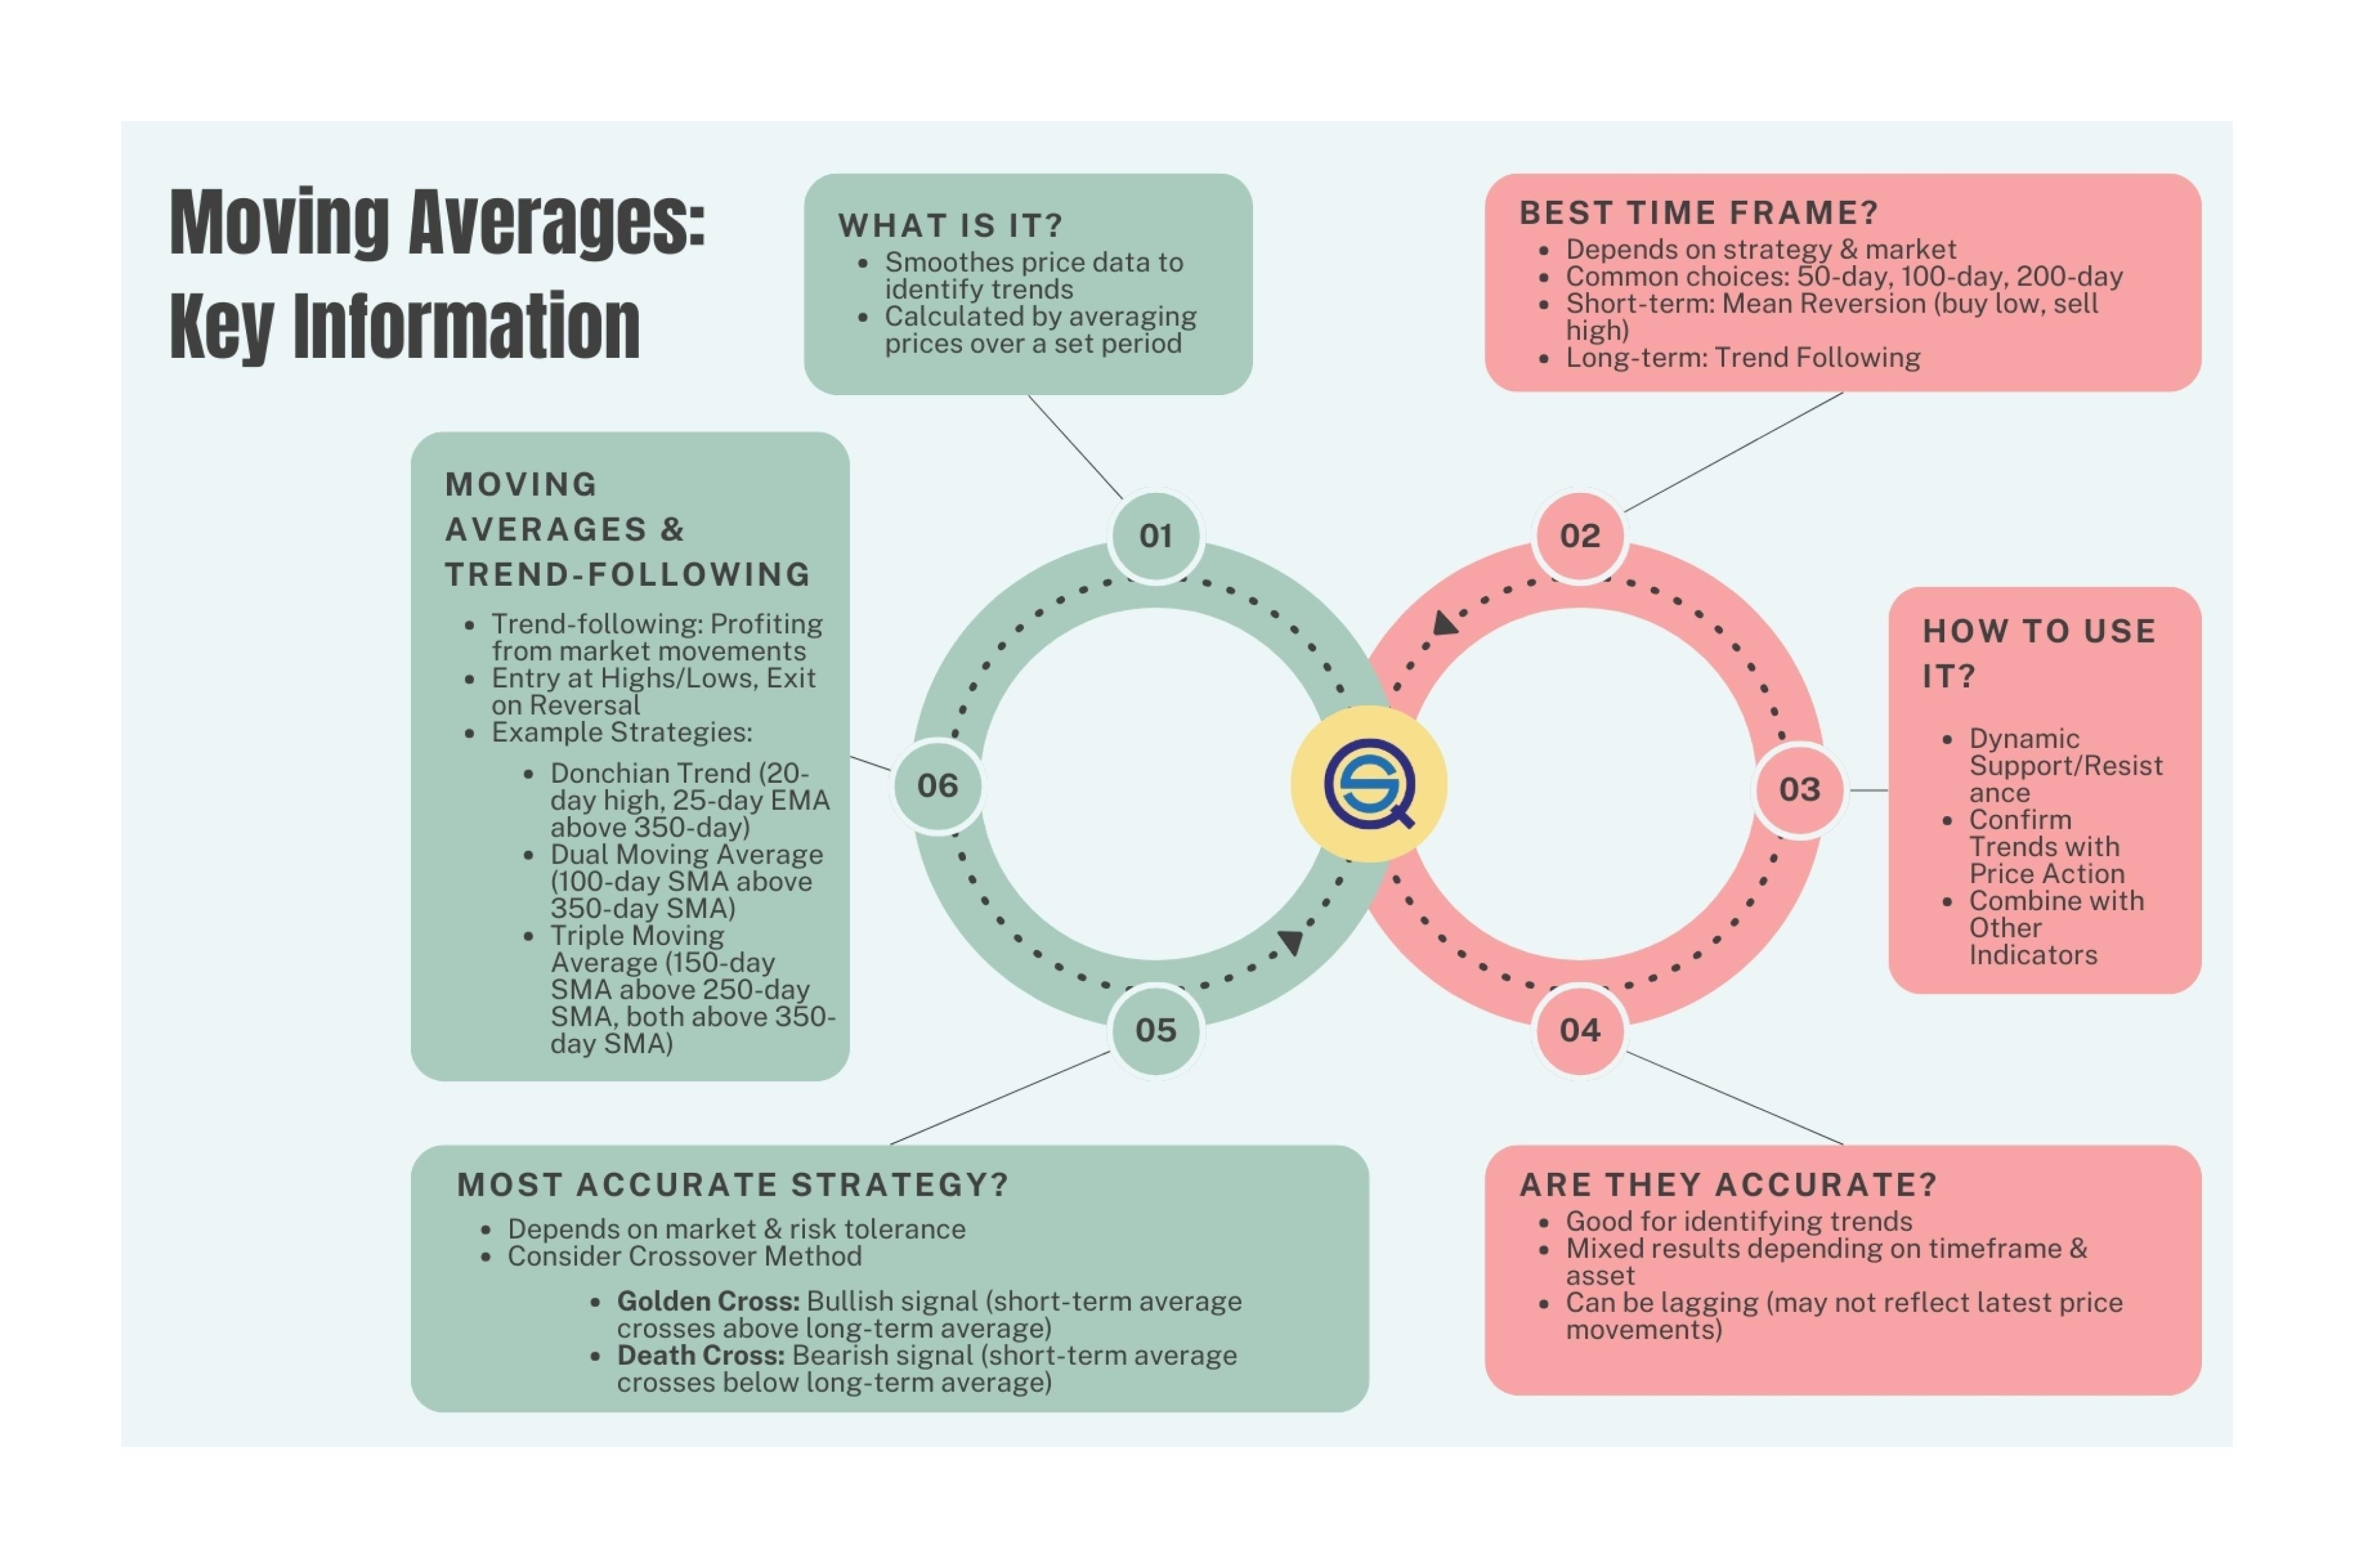
A moving average (MA) is a technical indicator that calculates the average price of an asset (stock, forex, etc.) over a specific time period. It is commonly used in trading to smooth out short-term fluctuations in price and highlight longer-term trends. The term "moving" refers to the fact that the average is continuously recalculated using the most recent data points as new prices become available.
The primary function of moving averages is to identify trend direction. When the price is above the moving average line, it generally indicates an upward trend, while prices below suggest a downward trend.
Traders use MAs to assess whether an asset is moving in a bullish or bearish direction, and these averages help generate signals for entering or exiting trades.
Moving averages are also integral to other technical indicators, such as the moving average convergence divergence (MACD) and Bollinger Bands. These combinations provide deeper insights into market trends and potential reversals.
Moving averages provide key benefits for traders:
Trend Identification: They help spot overall market directions - up, down, or sideways. This guides traders in creating strategies that align with current market conditions.
Signal Generation: By examining how prices interact with moving average lines, traders can spot potential buy and sell opportunities. For instance, when prices consistently break above a rising Simple Moving Average (SMA), it might suggest a good time to buy.
Dynamic Support and Resistance: Moving averages often serve as flexible support and resistance levels. Prices frequently bounce off long-term moving averages (acting as support) and struggle to break through short-term ones (acting as resistance).
Fast Fact
The moving average formula was first introduced in 1901 by the British statistician R. H. Hooker, who called it the "instantaneous average." However, it wasn't used for trading until the early 20th century, when the technical analyst J.M. Hurst adapted it for analysing financial markets. Hurst's research on cyclical price patterns led to the development of the modern moving average technique, which is still widely used today.
There are two primary types of moving averages: simple moving averages (SMA) and exponential moving averages (EMA). While the SMA gives equal weight to all data points, the EMA gives more weight to recent prices, making it more responsive to new information.
Both are valuable tools in technical analysis, but each has strengths and weaknesses depending on the trading strategy and market conditions.
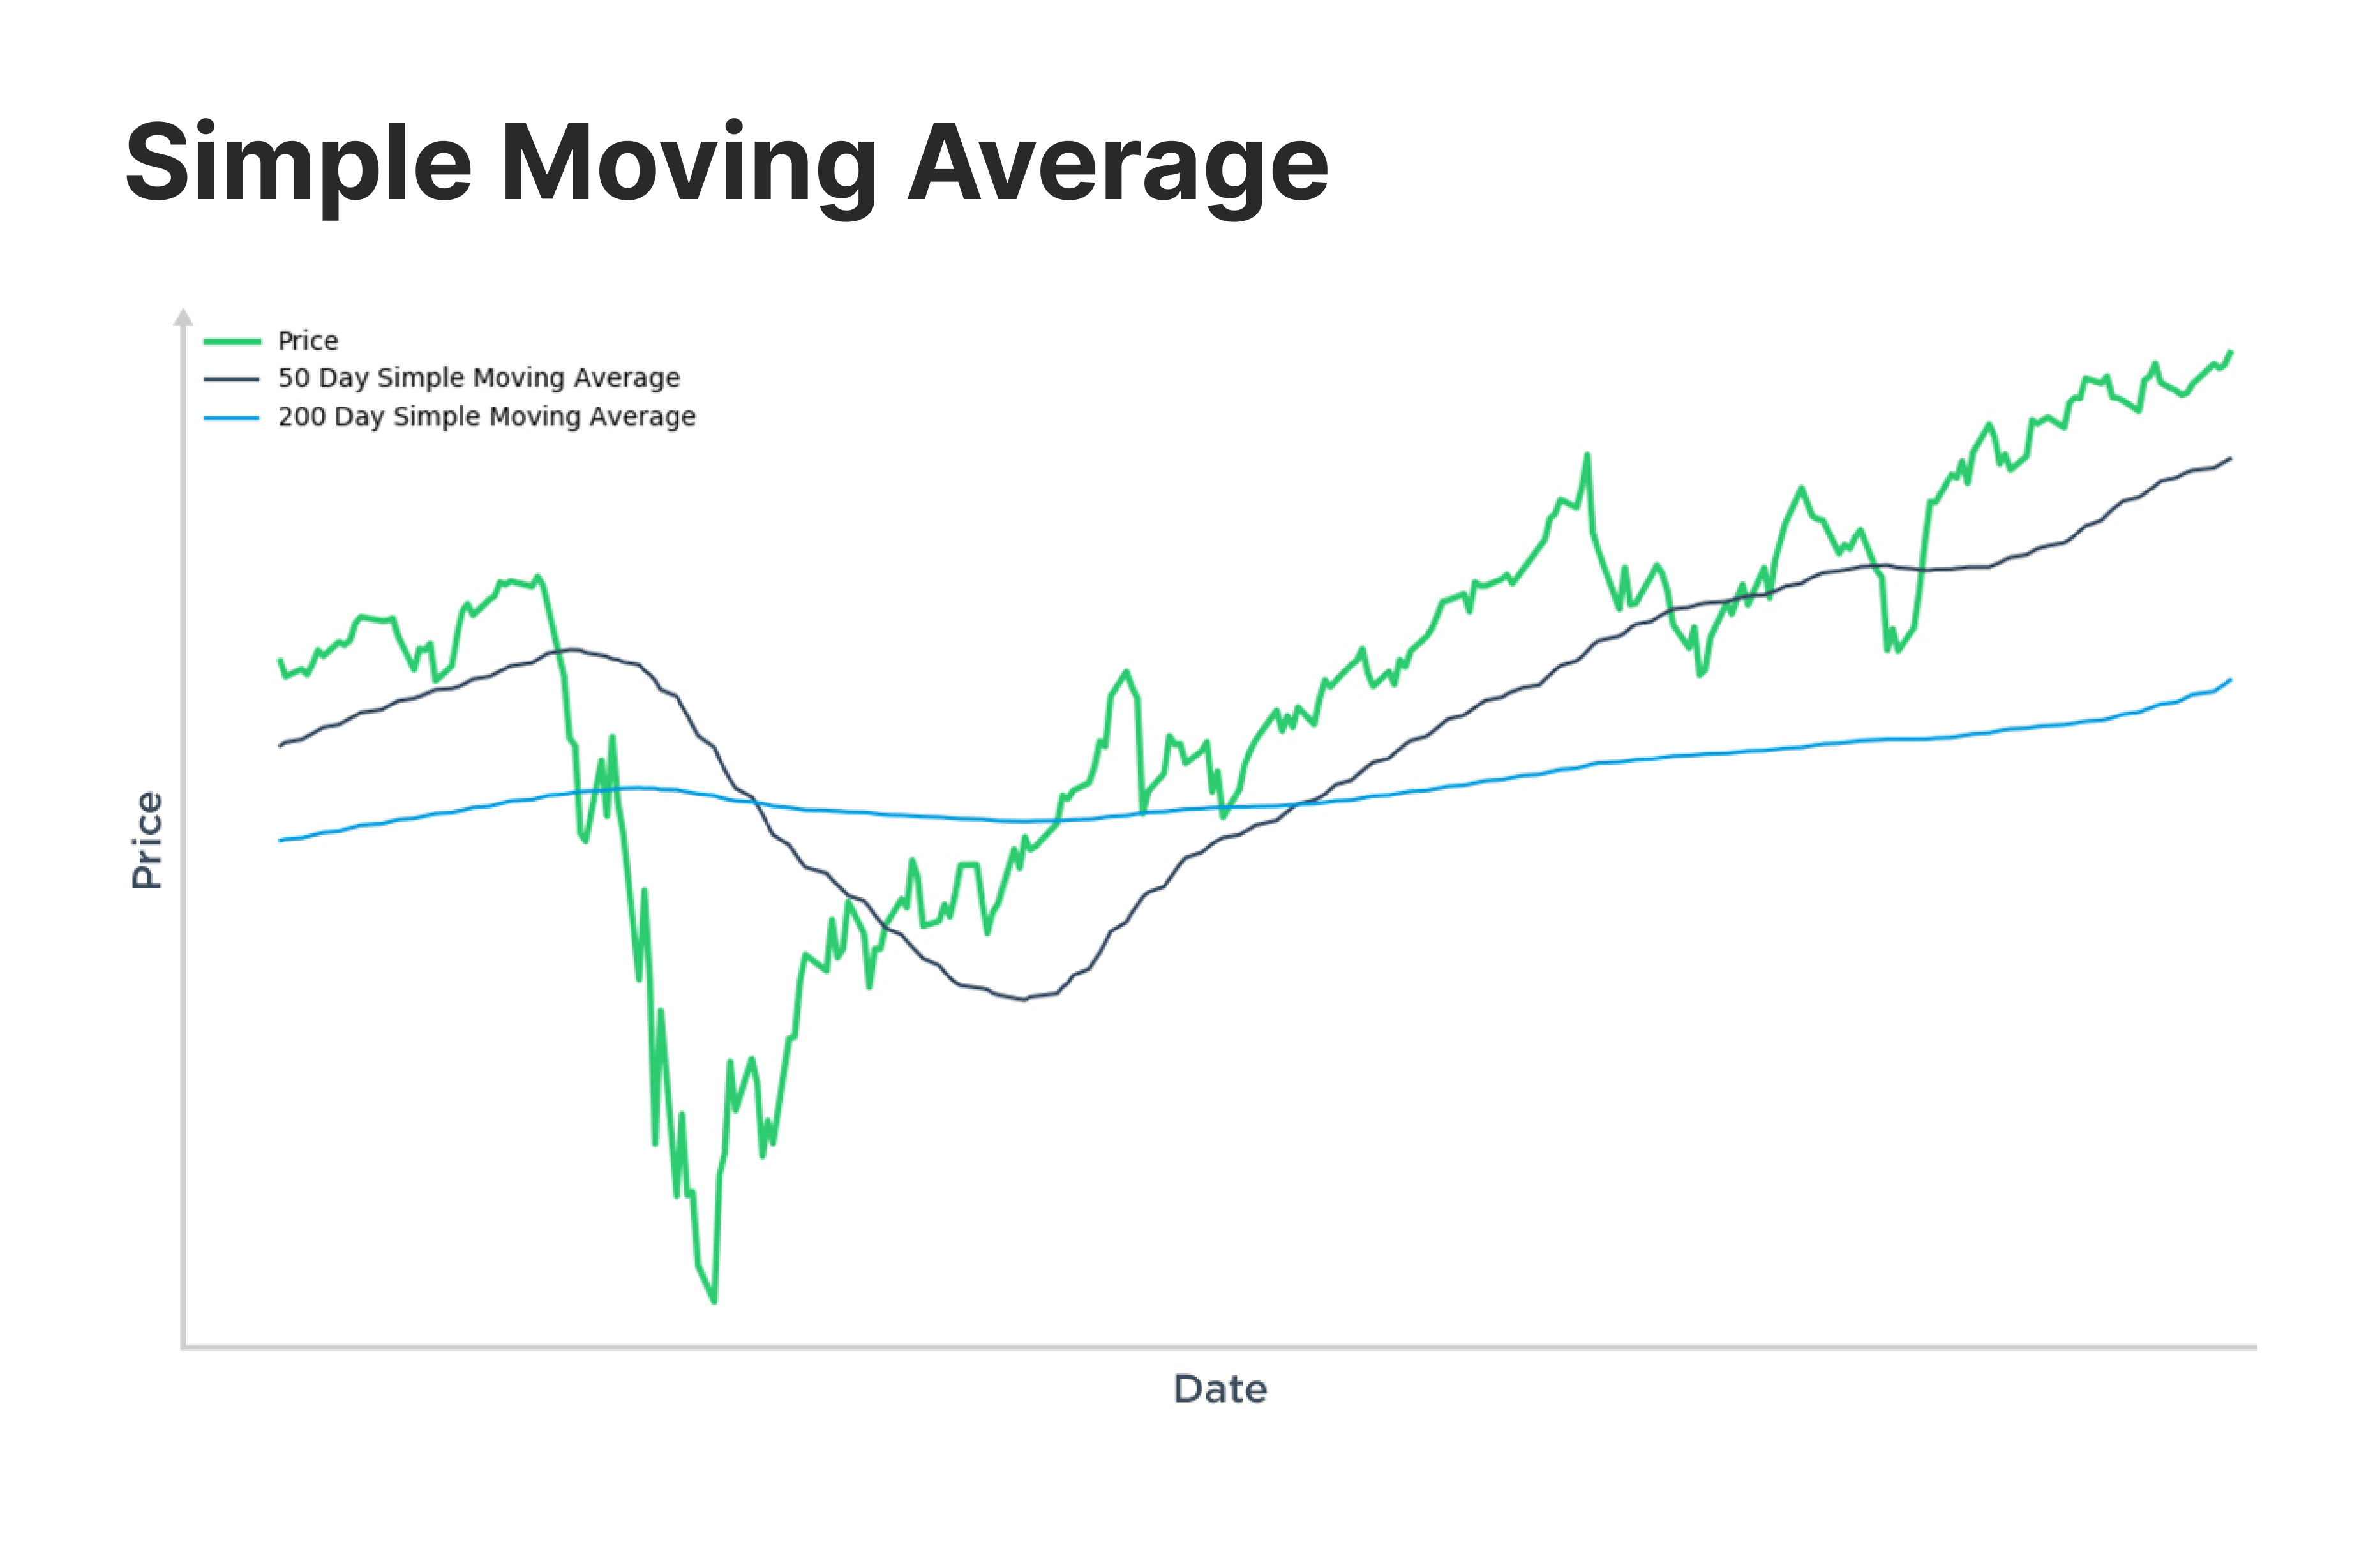
Simple Moving Average (SMA) is the most basic type of moving average. It's calculated by simply adding the closing prices of a security over a chosen period and then dividing by the number of periods. Traders widely use it to track long-term trends and assess support and resistance levels.
Exponential Moving Average (EMA) gives more weight to recent price data, making it more responsive to price changes. This is especially useful for short-term traders and those looking for quick reactions to price movements.
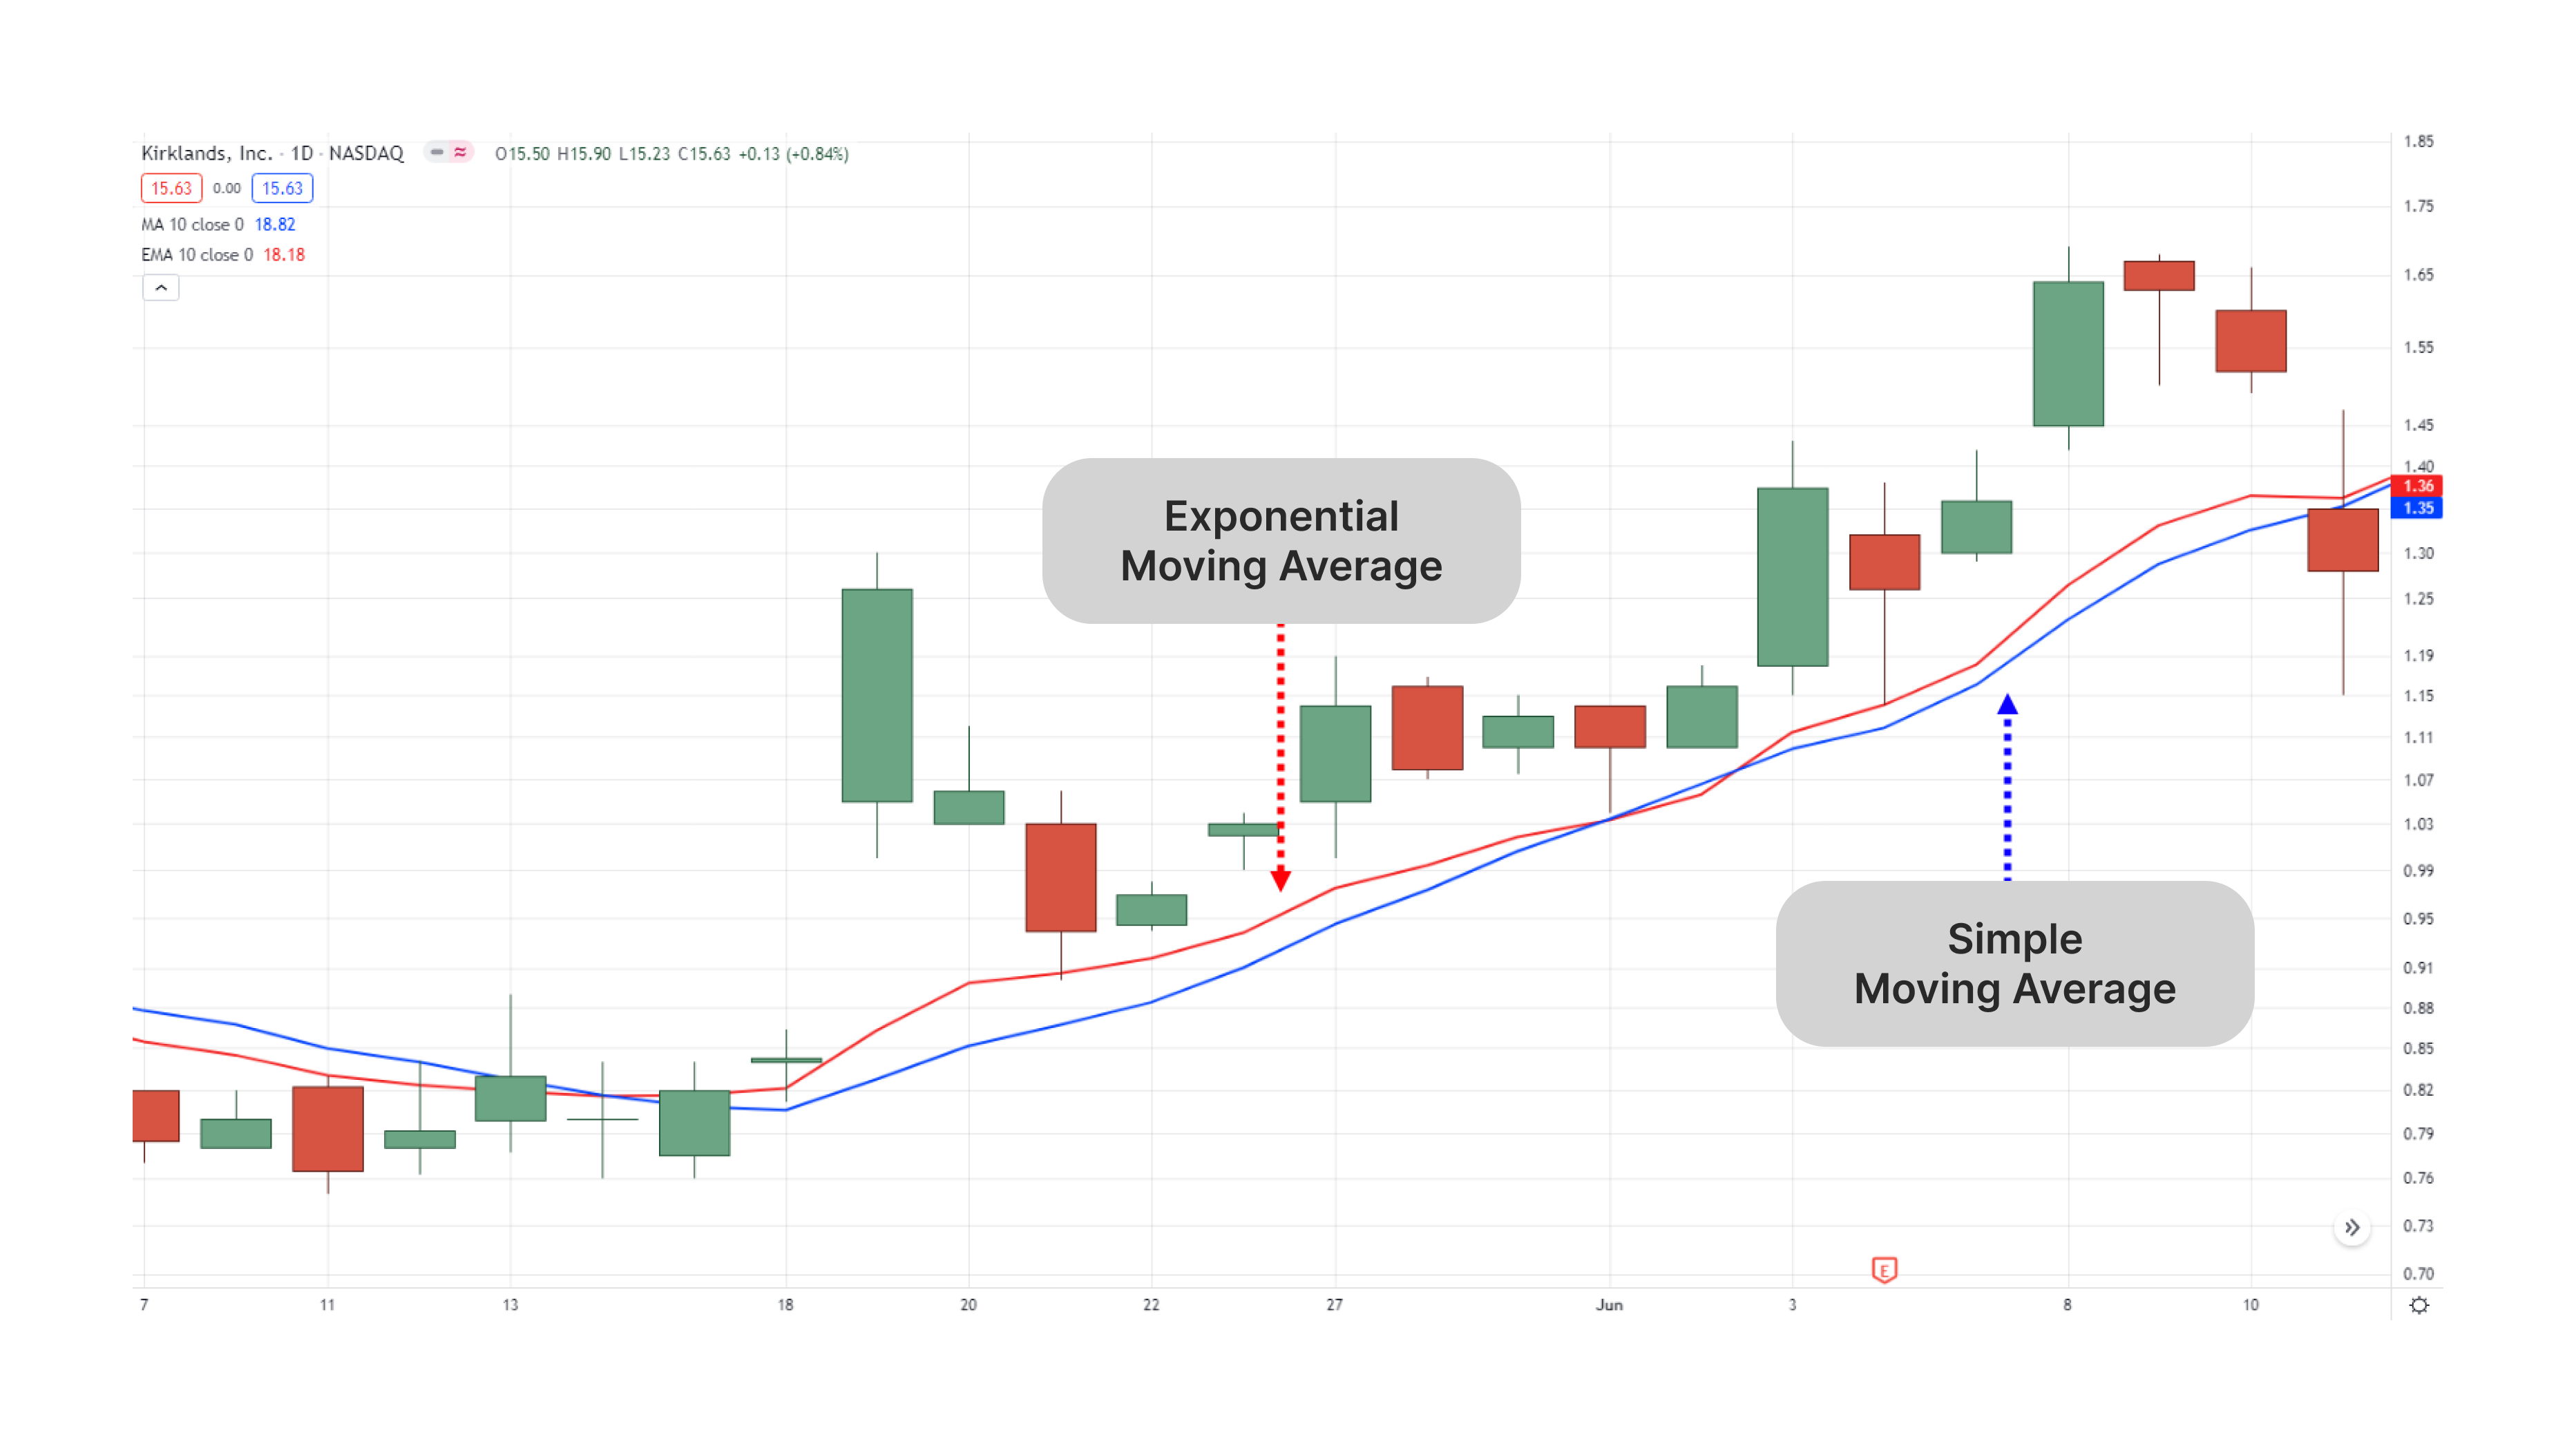
Knowing how they are calculated is essential to fully understanding moving averages. Most charting software platforms offer built-in functionality to calculate moving averages.
Simply choose the type of moving average (SMA or EMA) and specify the desired time period (e.g., 50-day SMA). The platform will automatically calculate and display the moving average on your chart.
SMA = (P1 + P2 + ... + Pn) / n
Where:
P = Price
n = number of periods
For example, let's say it's the end of March, so your first sales quarter is almost over. To get the simple moving average (SMA), you divide the total sales from January to March by the number of periods, which in this case would be 3 (3 months), giving you a simple average number of sales per month.
EMA = (Close - Previous EMA) × (2 / (n + 1)) + Previous EMA
Where:
Close = Current closing price
Previous EMA = EMA value from the previous period
n = number of periods
For instance, in the case of a 20-day moving average, the multiplier is computed as [2/ (20+1)] = 0.0952. Computation of the Current EMA: Ultimately, the current EMA is calculated using the subsequent formula: EMA = (Closing price x multiplier) + [EMA (from the previous day) x (1 - multiplier)]. The EMA reacts more quickly to recent price changes, which can be advantageous in fast-moving markets.
The term "rolling average" is often used interchangeably with moving average. This is because the moving average is constantly "rolling" forward as new price data becomes available. The calculation excludes the oldest data point and includes the latest closing price, effectively keeping the average current.
Traders often use this technique to keep the average current, which helps analyse real-time data and identify market trends.
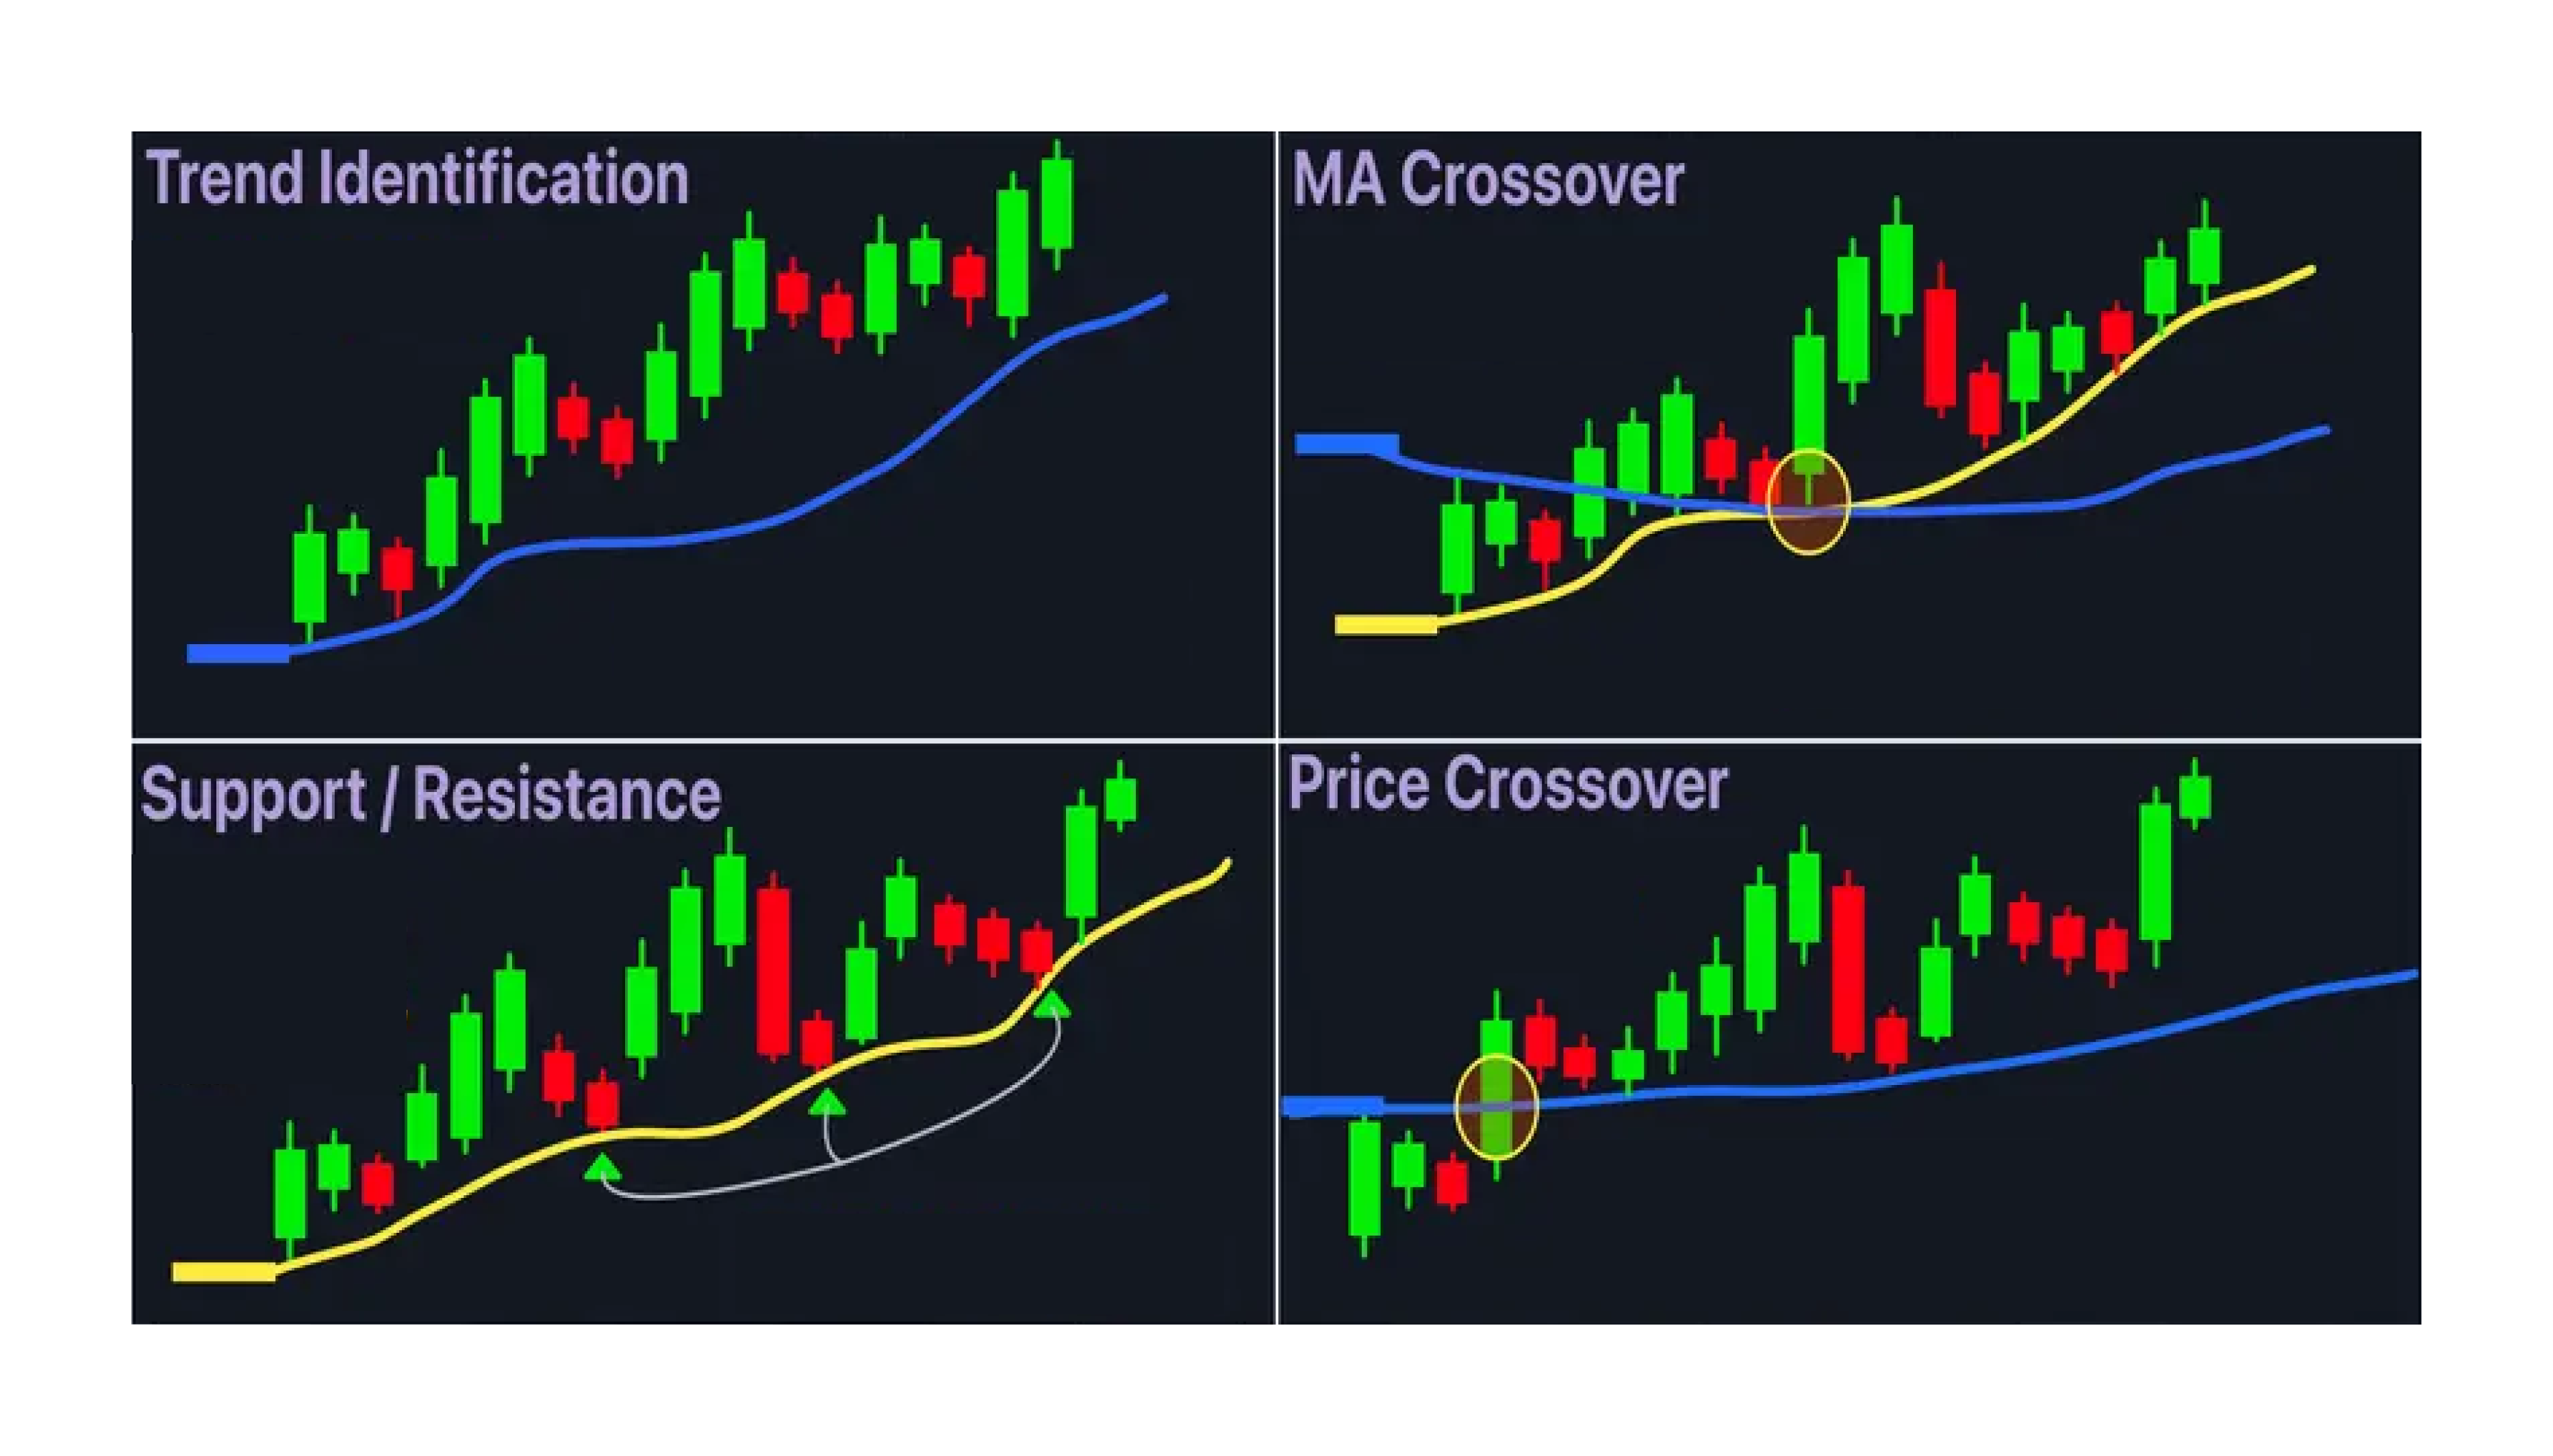
Moving averages are versatile tools that can be integrated into various trading strategies. Here are some common approaches:
One of the primary uses of moving averages is to identify the overall trend direction. When the price is consistently above a moving average, it generally indicates an uptrend. Conversely, when the price is below the moving average, it suggests a downtrend. By observing the price position relative to the moving average line, traders can determine whether the market is trending upward, downward, or moving sideways.
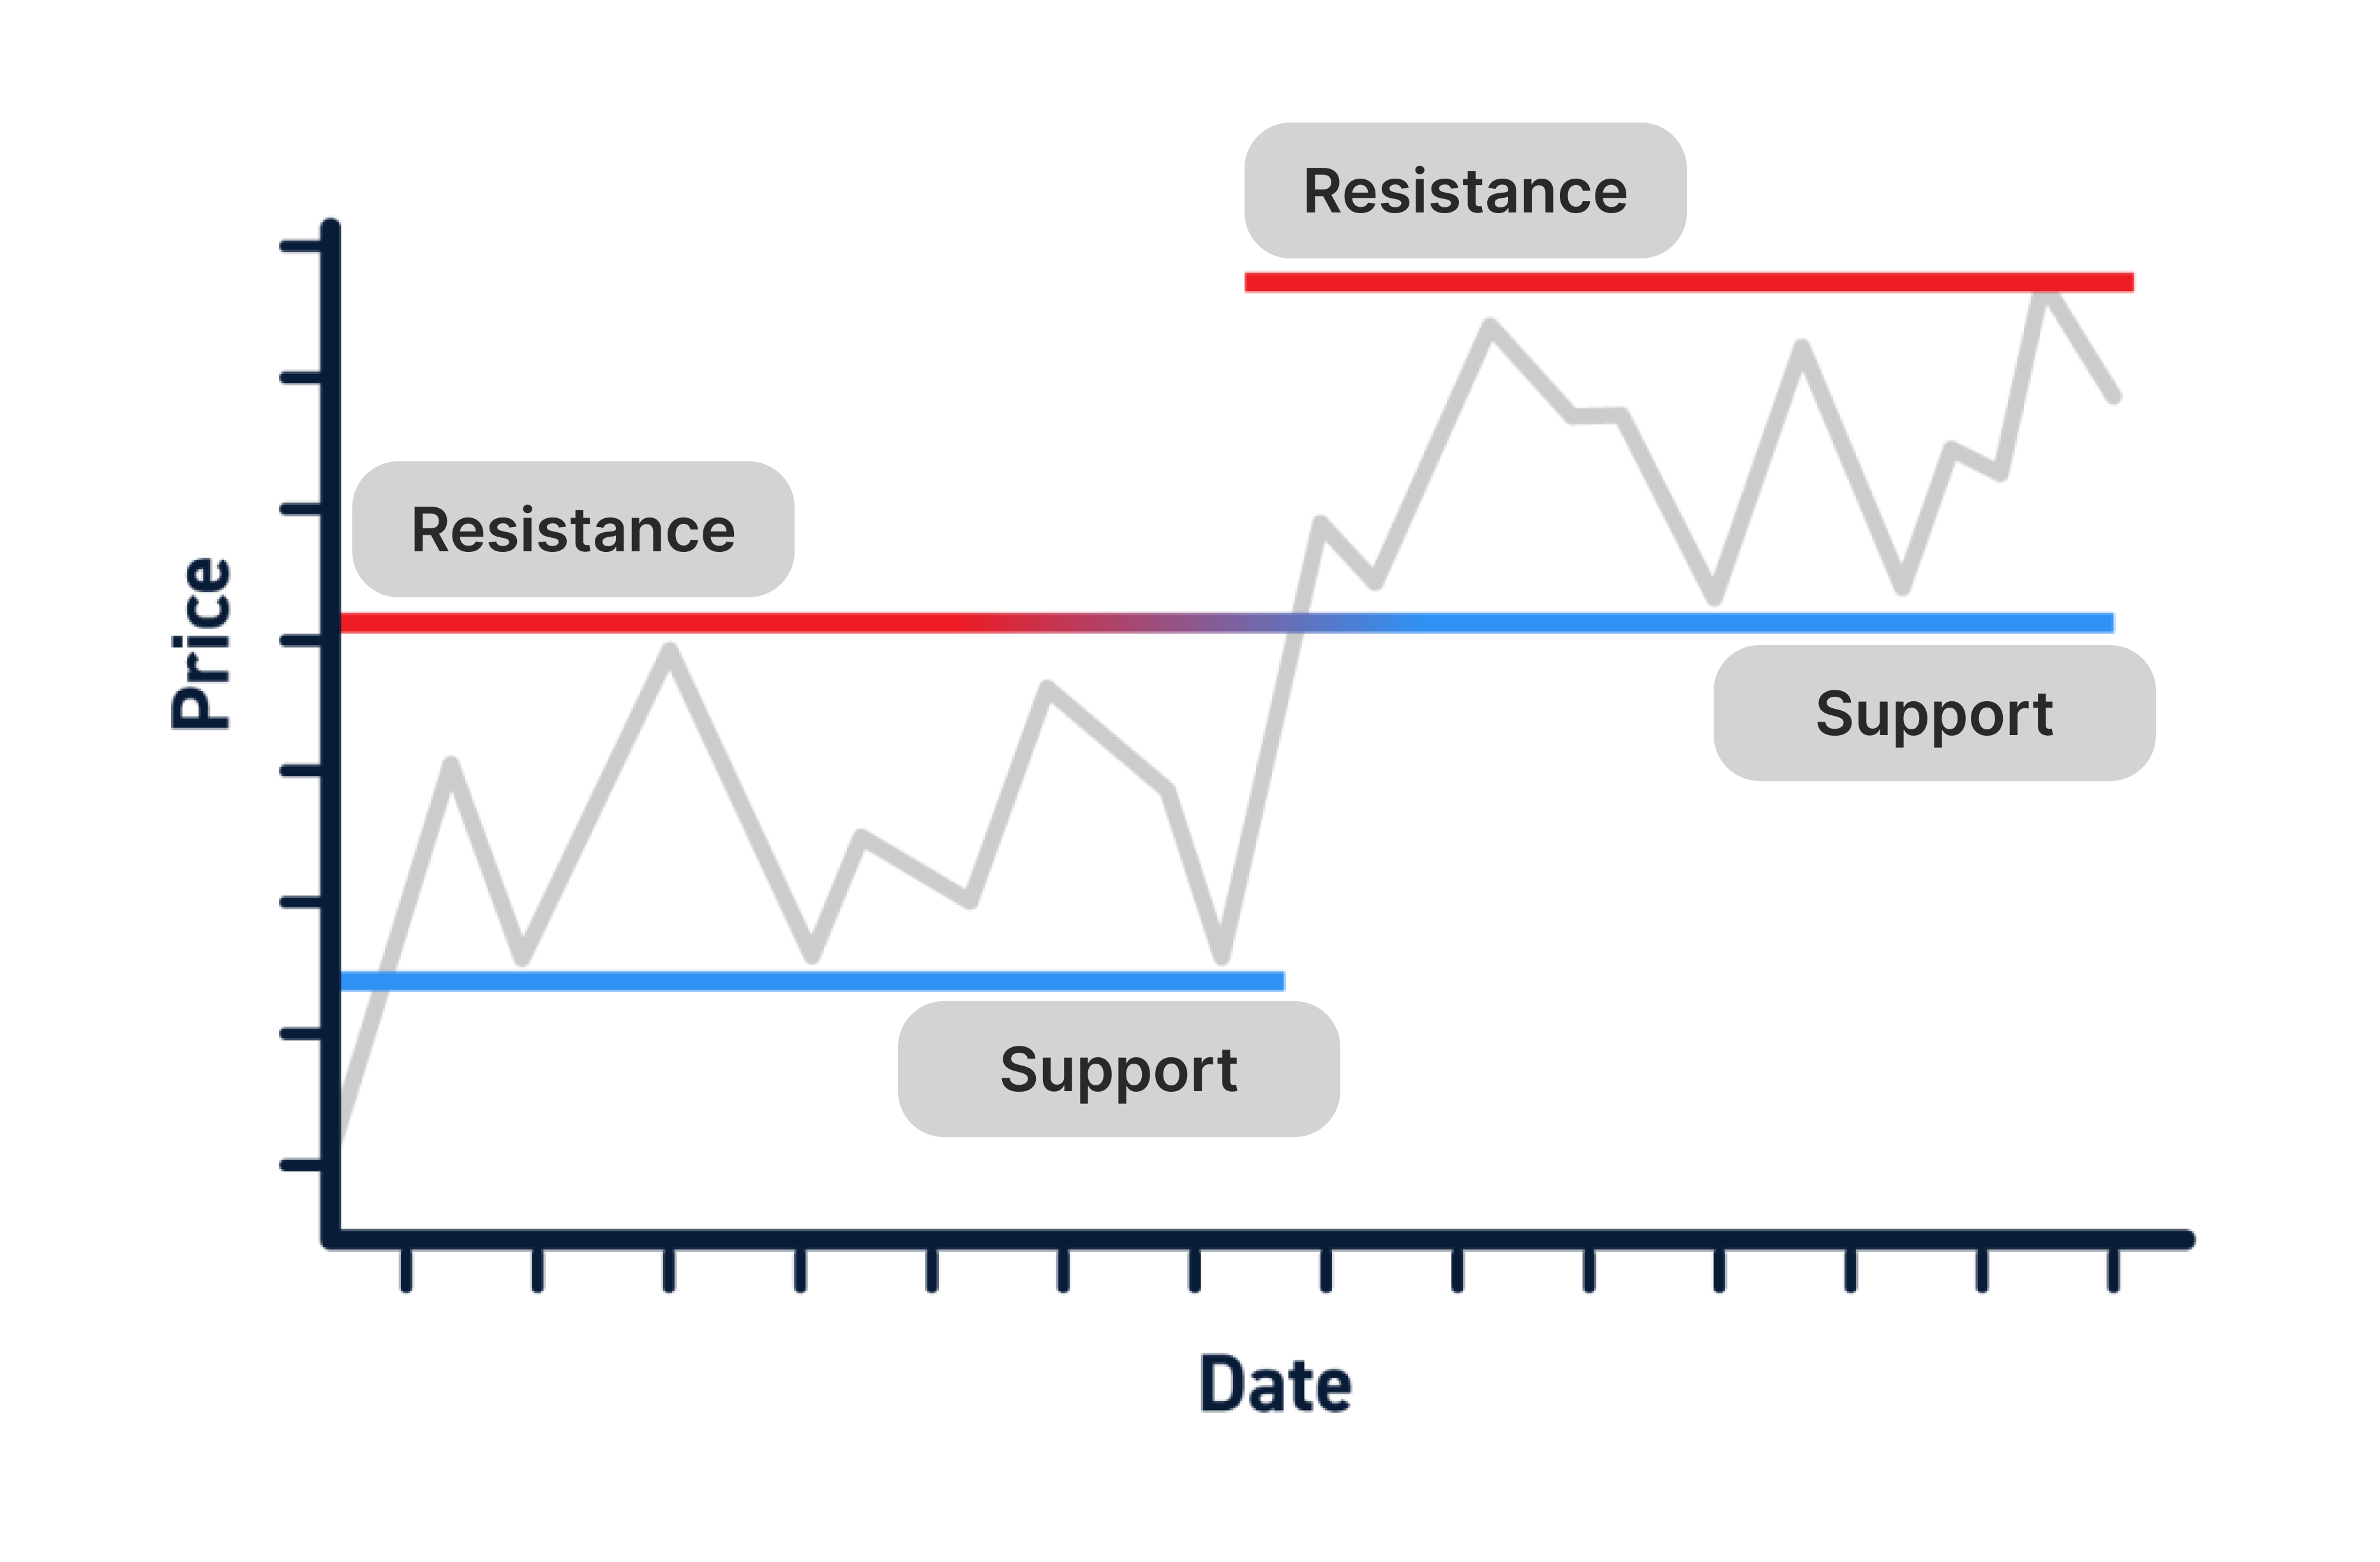
Moving averages act as dynamic support and resistance levels. For example, during an upward trend, the moving average can serve as a support level where prices bounce back. It can act as resistance in a downward trend, preventing prices from rising further.
The crossover strategy is one of the most common trading strategies involving moving averages. It occurs when a shorter-term moving average crosses over a longer-term one, indicating a change in trend. For instance, in a 50-day and 200-day moving average crossover, it's considered a bullish signal if the 50-day SMA crosses above the 200-day SMA.
Traders often use crossovers between different moving averages as buy or sell signals. For example:
Golden Cross: When a shorter-term moving average crosses above a longer-term moving average, it's considered a bullish signal.
Death Cross: When a shorter-term moving average crosses below a longer-term moving average, it's seen as a bearish signal.
The MACD is a popular indicator that uses moving averages to indicate the market's momentum and potential reversal points. It measures the difference between two EMAs (typically the 12-period and 26-period EMAs) and plots it on a chart. When the MACD line crosses above the signal line, it generates a buy signal, while crossing below indicates a sell signal.
Many traders use multiple moving averages with different time periods to confirm trends and generate more reliable signals. For example, a trader might use a combination of 10-day, 50-day, and 200-day moving averages to assess short-term, medium-term, and long-term trends, respectively.
In this strategy, traders use two moving averages with different periods, such as a 10-day and 30-day EMA. When the shorter-term moving average exceeds the longer-term one, it signals a potential buying opportunity. Conversely, when the shorter-term MA surpasses the longer-term one, it generates a sell signal.
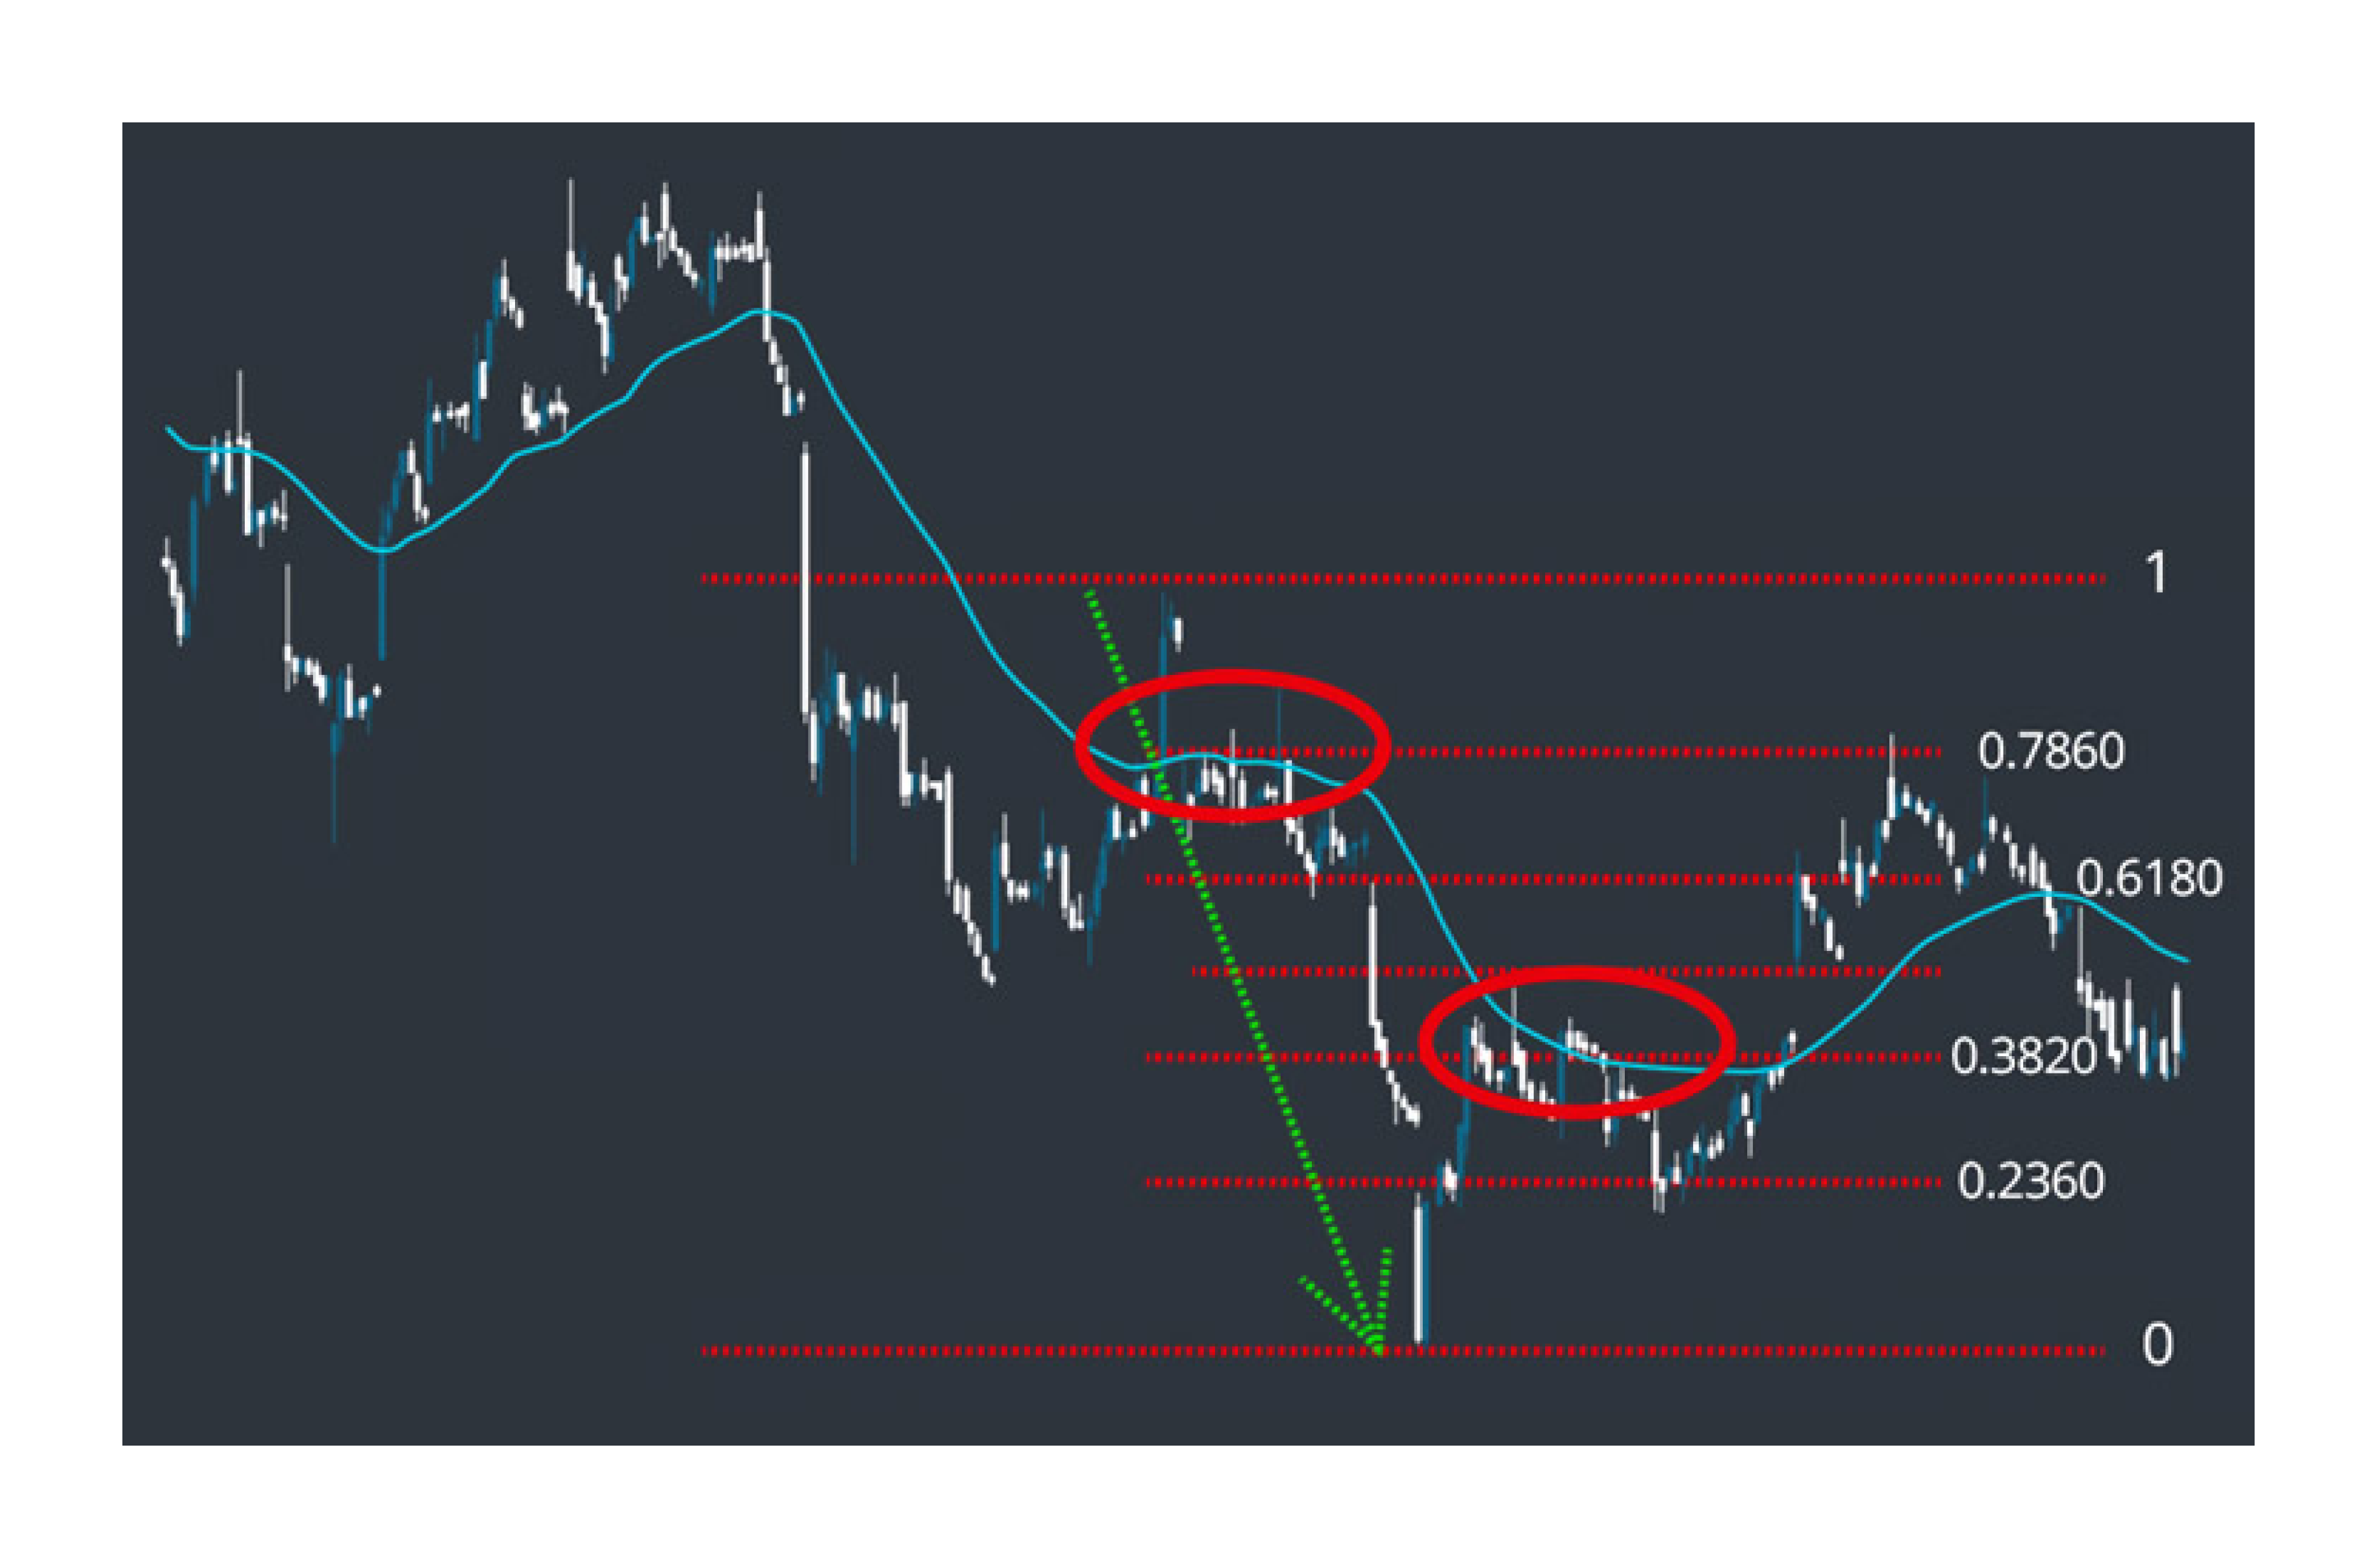
Moving averages are frequently used alongside Fibonacci retracement levels to predict potential areas of support and resistance. Fibonacci bands are created by plotting horizontal lines on a price chart based on key Fibonacci ratios (such as 61.8%, 50%, and 38.2%).
Traders combine the moving average with Fibonacci bands to better identify possible entry and exit points and confirm the strength of a trend. This combination provides additional layers of analysis, making detecting reversal signals and potential market movements easier.
Moving averages help traders not only to identify trends but also to confirm them. By observing the slope of the moving average, traders can assess the strength of a trend. A sharply upward-sloping moving average indicates strong bullish momentum, while a downward slope points to a bearish market.
EMAs are particularly useful for intraday traders who need quick, responsive indicators for short-term price movements. The EMA helps capture recent data points more effectively, allowing traders to react faster to market changes and generate trading signals in real-time.
Here are practical tips for the proper usage of moving averages in trading:
The appropriate time period for your moving average will depend on your trading style and market conditions. Short-term traders might prefer shorter timeframes, while long-term investors might use longer timeframes.
The effectiveness of moving averages can vary depending on market conditions. They may be less reliable during periods of high volatility or market consolidation.
For a more comprehensive analysis, combine moving averages with other technical indicators to confirm signals and reduce the risk of false trades.
Backtest your moving average strategies using historical data to evaluate their performance and identify potential pitfalls.
Always practise proper risk management techniques, such as setting stop-loss and take-profit levels, to protect your capital.
While moving averages are potent tools, relying solely on them without considering other technical indicators can be risky. To make well-rounded trading decisions, using them alongside other methods, such as support and resistance levels, candlestick patterns, or the MACD, is essential.
Avoid mistakes and consider their limitations while using moving averages:
Moving averages are indispensable tools in the arsenal of both novice and experienced traders. They provide valuable insights into market dynamics by smoothing out price data and highlighting trends. Moving averages offer a solid foundation for developing robust trading strategies, whether alone or combined with other technical indicators.
Remember, while moving averages can provide valuable insights, they should never be used in isolation. When making trading decisions, consider multiple factors, including fundamental analysis and broader market conditions.
By mastering the art of using moving averages in conjunction with other strategies, traders can better understand market dynamics, make more informed decisions, and enhance their overall trading performance.
A moving average (MA) is an indicator that calculates the moving average of an asset to smooth out the price data over a specified period by creating a constantly updated average price.
An exponential moving average (EMA) is a widely used technical chart indicator that tracks changes in the price of a financial instrument over a certain period. Unlike simple moving averages (SMA), EMA emphasises recent data points like the latest prices.
A moving average is a technical indicator that market analysts and investors may use to determine the direction of a trend. It sums up the data points of financial security over a specific period and divides the total by the number of data points to arrive at an average.
The formula for calculating the Simple Moving Average (SMA) is straightforward. It represents the average closing price of a security over the last "n" periods. For example, with a 5-day SMA, at Day 10 (n=10), the 5-day SMA is $18.60. Similarly, with a 10-day SMA, the value at Day 10 (n=10) comes out to $14.90.